


Modern AI agents are no longer simple scripts—they are multi-step, multi-model systems that make decisions, call tools, retrieve context, and generate responses autonomously. When something goes wrong, or when you want to improve performance, you need visibility into every part of that pipeline. This is where OpenTelemetry (OTEL) comes in.
OpenTelemetry is the open-source observability standard that gives you a unified, vendor-neutral way to collect traces, logs, and metrics from your AI systems. At Ascending, our Jarvis AI governed platform uses OTEL as the foundation for agent observability—giving teams actionable insight without locking into any single monitoring vendor.
This post explains the three pillars of OTEL observability and how each applies to AI agents at a conceptual level.
Why AI Agents Need Observability
Traditional application monitoring focuses on latency, errors, and throughput. AI agents add a new layer of complexity:
- A single user request may chain multiple LLM calls, tool invocations, and retrieval steps.
- The “right” answer is often non-deterministic, making quality invisible without structured signal.
- Token consumption directly drives cost—and visibility into usage patterns is essential for budgeting and optimization.
Without observability, tuning an agent is guesswork. With OTEL, you get structured data you can act on.
The Three Pillars: Traces, Logs, and Metrics
1. Traces — Understanding the Full Request Journey
What it is: A trace captures the end-to-end flow of a single request through your agent system. Each step in the agent pipeline—receiving the query, retrieving context, calling the LLM, executing a tool, returning a response—is recorded as a span within that trace.
Why it matters for AI: Traces are the most powerful signal for iterating on your prompts and debugging your agent pipeline. When a response is poor or a request takes too long, you can walk back through the exact trace to see:
- Which prompt version was used
- What context was retrieved (and whether it was relevant)
- How many LLM hops occurred before the final response
- Where latency was introduced in the chain
This makes traces indispensable for iterative prompt engineering and model evaluation. Instead of re-running experiments in isolation, you capture real production behavior and use it as a feedback loop for refinement.
Key components in a trace-enabled agent setup:
| Component | Role |
|---|---|
| Trace Instrumentation | Wraps each agent step and emits span data |
| Context Propagation | Carries the trace ID across async boundaries and external calls |
| OTEL SDK | Captures and forwards spans from your application code |
| Telemetry Collector | Receives, processes, and routes spans to a backend |
2. Logs — Structured Application Visibility
What it is: Logs record discrete events in your application—errors, state transitions, decisions, and warnings. In an OTEL-compliant setup, logs are structured (JSON or key-value) and correlated with the trace they belong to via a shared trace ID.
Why it matters for AI: Agents often fail silently. A tool call returns an unexpected result, a retrieved document is empty, or a model outputs a malformed JSON response—without logs, you won’t know until a user complains. With structured logs tied to traces, you can:
- Pinpoint the exact agent decision that led to a failure
- Audit tool calls and their inputs/outputs
- Monitor for unexpected behaviors (hallucinated tool names, repeated retries, context truncation)
- Track application-level health separately from model performance
Logs serve as the narrative layer of your observability stack—giving human-readable context to the numbers in your metrics and the paths in your traces.
Best practice: Emit structured logs at key agent lifecycle events: session start, LLM call dispatched, tool result received, response generated, session end.
3. Metrics — Measuring Agent Performance
What it is: Metrics are numerical measurements aggregated over time. For AI agents, the most meaningful metrics include request counts, error rates, latency distributions, and—critically—token usage.
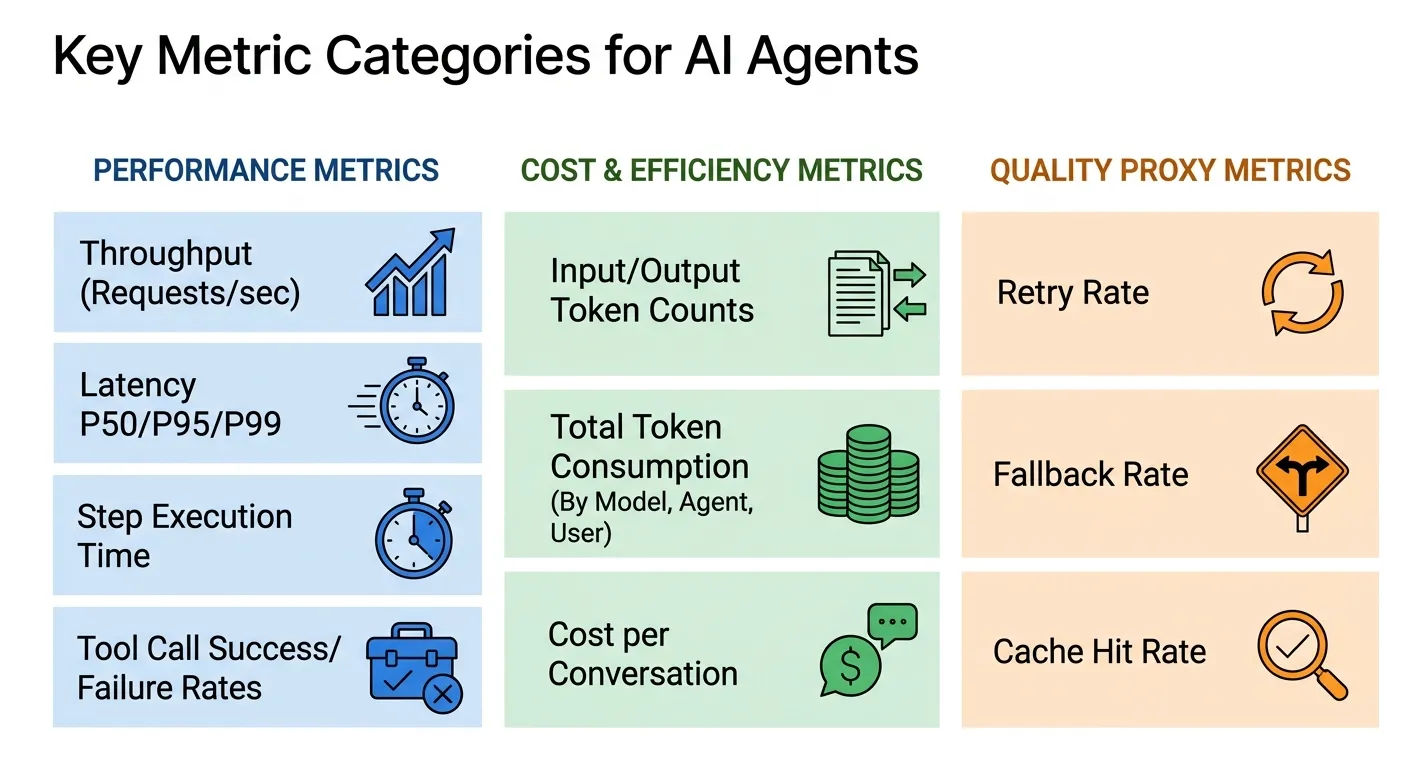
Why it matters for AI: Metrics answer the question: how is my agent performing at scale? Key metric categories for AI agents include:
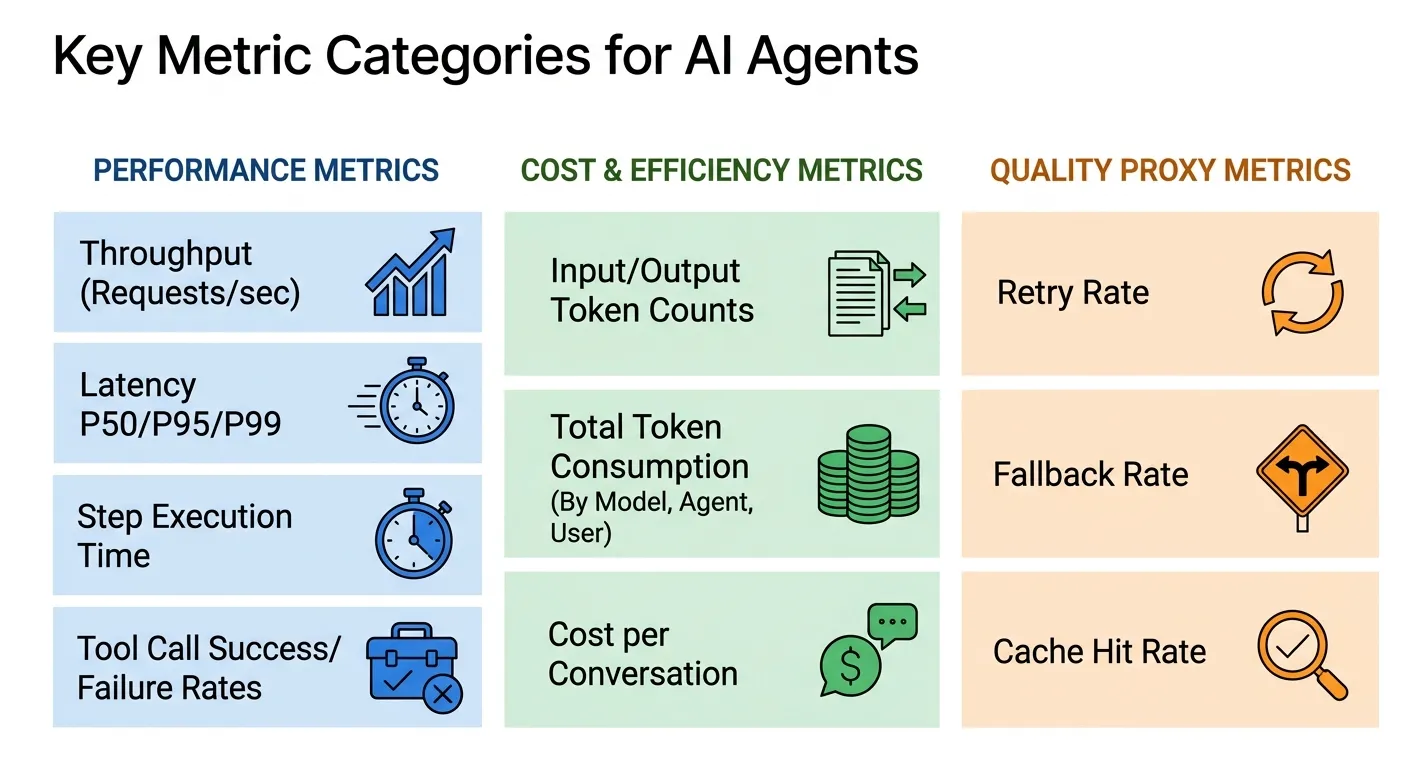 Performance Metrics
- Request throughput (requests per second)
- End-to-end response latency (P50, P95, P99)
- Agent step execution time
- Tool call success/failure rates
Cost & Efficiency Metrics
- Input token count per request
- Output token count per request
- Total token consumption over time (by model, by agent, by user)
- Cost per conversation
Quality Proxy Metrics
- Retry rate (high retries often indicate prompt or tool issues)
- Fallback rate (how often the agent defers to a human or a simpler path)
- Cache hit rate for retrieval steps
Token metrics deserve special attention. Because LLM APIs charge per token, monitoring token usage per agent, per use case, and per model gives you direct cost visibility. Combined with traces, you can identify which prompt templates or retrieval strategies are token-heavy and optimize accordingly.
See it in action: Watch how ASCENDING Inc uses Jarvis Registry to track LLM token usage in a live enterprise environment: Enterprise AI Observability — Track LLM Token Usage with Jarvis Registry
The Telemetry Collector: The Central Hub
All three signal types—traces, logs, and metrics—flow through the OpenTelemetry Collector. Think of the collector as a pipeline component that sits between your agents and your observability backends.
AI Agent → OTEL SDK → OTEL Collector → Backend (Grafana, Jaeger, Datadog, etc.)The collector has three stages:
- Receivers: Accept telemetry from your agents via OTLP (the OTEL protocol), or other formats.
- Processors: Transform, filter, batch, and enrich the data before it leaves the collector.
- Exporters: Send the processed data to one or more observability platforms.
This architecture means you can change your monitoring backend without touching your agent code—your instrumentation stays constant, only the exporter changes.
Putting It Together: A Governed AI Observability Architecture
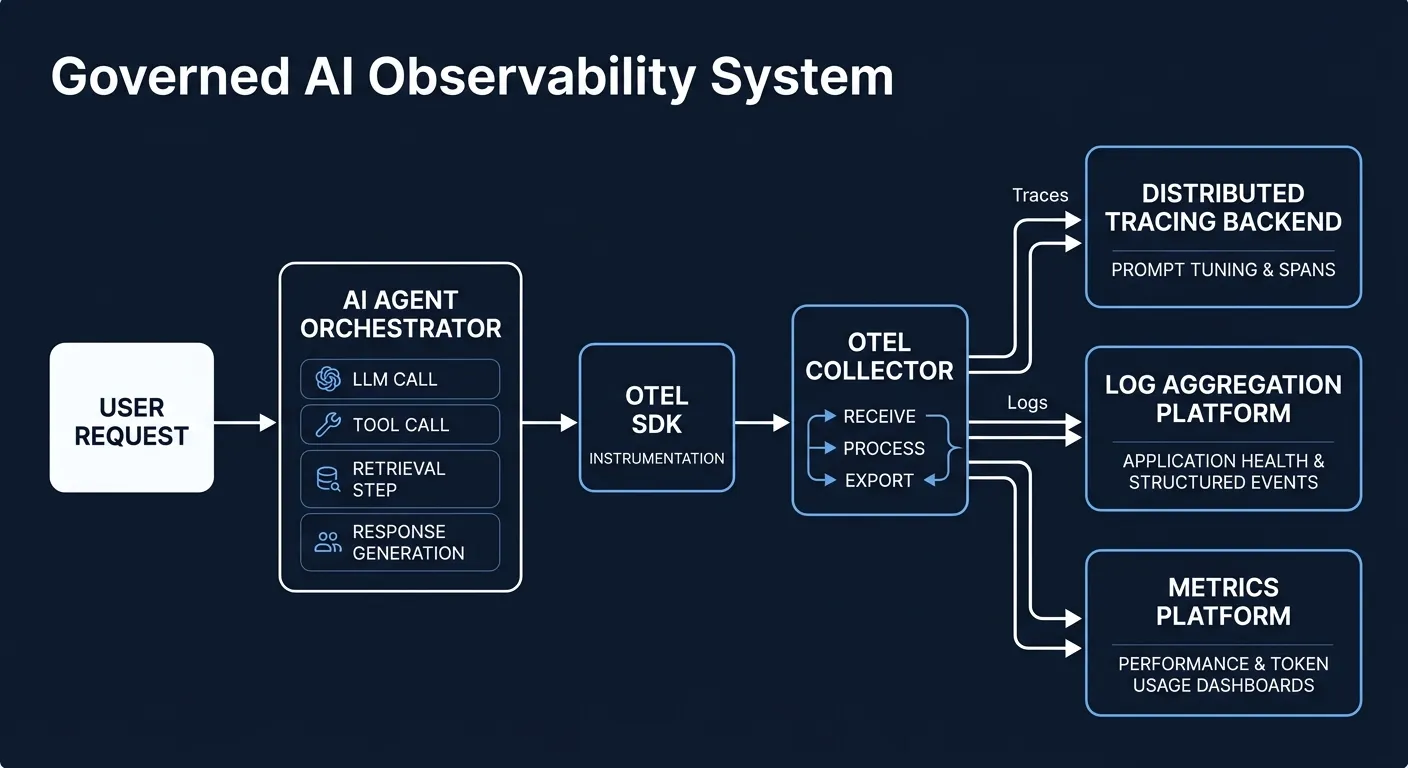
Each signal type answers a different question:
| Signal | Primary Question | Primary Use Case |
|---|---|---|
| Traces | What happened, step by step? | Prompt iteration, agent pipeline debugging |
| Logs | What did the application do and why? | Error diagnosis, audit trails, behavioral review |
| Metrics | How is the system performing over time? | Cost control, SLA monitoring, capacity planning |
Getting Started
Implementing OTEL for AI agents does not require a complete rewrite of your system. The key starting points are:
- Choose an OTEL-compatible SDK for your language/framework (Python, Node.js, Java, Go are all well-supported).
- Instrument your agent’s key steps — at minimum, wrap LLM calls and tool calls with spans and emit structured logs.
- Deploy an OTEL Collector as a sidecar or standalone service to centralize telemetry routing.
- Connect to a backend that your team already uses, or evaluate purpose-built LLM observability platforms.
- Define your metrics dashboard starting with token usage, latency, and error rate.
The Fast Path: Jarvis Registry
If you’d rather skip the instrumentation wiring entirely, Jarvis Registry is an open-source agent platform that adheres to the OpenTelemetry standard out of the box. OTEL traces, logs, and metrics are emitted automatically for every agent interaction—no manual span wrapping required. You can explore and contribute to the project at jarvisregistry.com.
For teams that need production-grade support, ASCENDING Inc offers a managed service and enterprise customization for Jarvis Registry—covering hosted telemetry pipelines, custom dashboards, and integration with your existing observability stack. Contact us to learn more.
For a deeper look at our Governed AI platform overview.
Summary
This article has walked through the concrete building blocks of agent observability using OpenTelemetry: how traces expose every step of a request for prompt and model refinement, how structured logs give you an auditable narrative of application behavior, and how metrics—especially token usage—keep performance and cost in check at scale.
Implementing these three signals yourself is achievable with any OTEL-compatible SDK and a Collector deployment. But if you want a one-click path to full observability without the instrumentation overhead, Jarvis Registry bundles OTEL-native telemetry out of the box—so your agents are observable from day one. Enterprise teams can reach Ascending for a managed deployment tailored to their stack.
Together, these three signals transform your AI agent from a black box into a transparent, governable system—one that you can confidently iterate, optimize, and scale.
References
- OpenTelemetry Official Documentation — Specification, SDKs, and Collector configuration guides.
- OpenTelemetry Collector — Architecture, receivers, processors, and exporters.
- Ascending — Governed AI Platform — Overview of OTEL-based observability in Jarvis AI.
- Jarvis Registry — Agent Observability Setup — Internal setup guide for agent telemetry pipelines.
- Jarvis Registry Open Source — Open-source agent platform with built-in OTEL compliance.
- Enterprise AI Observability: Track LLM Token Usage with Jarvis Registry — Video walkthrough of token metrics in a live enterprise environment.
- OpenTelemetry Semantic Conventions for Generative AI — Standard attribute names for LLM spans and token metrics.