
Water Utility AI Transformation: Closing the Analytics Readiness Gap
Water Utility AI Transformation: Closing the Analytics Readiness Gap
When your executive team asks whether your utility is “ready for AI” the honest answer is almost always: it depends on which AI. The gap between having operational data systems and having data infrastructure that actually supports AI workloads is wider than most utilities realize, and the capabilities that matter most for intelligent operations are precisely the ones that traditional utility platforms were never designed to provide.
I want to be very clear: SCADA systems, AMI platforms, Oracle ERP, and GIS solutions are not bad. They were designed for a world of operational control, meter reading, financial management, and spatial analysis. That world still exists and is important to us. But AI workloads are fundamentally different from operational data collection. AI models need clean, labeled, integrated, historically consistent data. They need real-time streams from multiple sources simultaneously. They need governance that makes model outputs auditable. And they need to serve field supervisors and customer service representatives who have never written a SQL query.
We map out the data capability requirements for water utility AI use cases, review the gap between what traditional utility platforms provide and what AI workloads actually require, and define the concept of an analytics readiness foundation (ARF): a unifying data layer that sits on top of an organization’s existing operational systems, bridging to the AI infrastructure that modern utility operations require.
The Four Data Flows That Define Utility Intelligence
Before diving into platform gaps it helps to understand what types of data flow a water utility actually needs to support for meaningful AI. I’ve found four distinct flows that require different integration architectures and carry different consequences when they fail:
| Flow | Concrete Example | What the Data Platform Must Do |
|---|---|---|
| Operational → Analytics | SCADA sensor readings flowing into predictive maintenance and power consumption models | Real-time streaming ingestion; schema normalization across Emerson and Rockwell systems; sub-minute latency for anomaly detection |
| Customer → Intelligence | AMI consumption data combined with billing records for Non-Revenue Water analysis | Billion-record processing; cross-system join between AMI, Oracle ERP, and Salesforce; validated data quality at ingestion |
| Asset → Prediction | GIS infrastructure data combined with maintenance history from Infor for failure forecasting | Geospatial integration; temporal alignment of asset age, maintenance events, and failure records across systems that were never designed to communicate |
| Regulatory → Compliance | Real-time water quality monitoring for EPA Safe Drinking Water Act and TCEQ reporting | Audit-grade data lineage; automated report generation; immutable logging with no manual intervention in the reporting chain |
The different flows create different architecture requirements. The operational and customer flows are the ones most utilities currently cannot handle for AI purposes. The operational flow needs real-time streaming integration that traditional batch ETL cannot provide. The customer flow exposes data quality and cross-system alignment failures that only become apparent when you try to train a Non-Revenue Water model and discover that your AMI and billing records disagree on consumption figures for a significant percentage of accounts.
The Five Capability Gaps That Actually Matter
The modern data platform landscape has dozens of features, but for water utility AI workloads five of them cause most of the friction. Understanding what each one does for AI operations and why it is needed forms the basis of any honest evaluation.
Data Governance and Quality — The Foundation Everything Else Depends On
Enterprise data platforms were traditionally designed around the assumption that data quality is someone else’s problem. Source systems own their data; downstream consumers work with what they receive. For traditional operational reporting, this is manageable. For AI model training, it is fatal.
A predictive maintenance model trained on data where 20% of asset records carry inconsistent equipment IDs, or where maintenance events are recorded with irregular timestamps, will not generalize. It will either overfit to the noise or fail to surface the failure signatures that matter. Microsoft Purview provides the automated data profiling, quality monitoring, lineage tracking, and cataloging required to understand what your data actually contains before you train anything on it. Without this layer, AI projects spend 70–80% of their effort on data remediation rather than model development. The data quality problem does not go away — it moves downstream where it is more expensive and slower to diagnose.
Real-Time Streaming Integration — The Gap Between SCADA and Insight
SCADA systems are designed for operational control, not analytics delivery. They generate continuous sensor data — pressure readings, flow rates, pump states, energy consumption, water quality measurements — at sub-minute granularity that represents the true operational reality of the distribution network. Most utility analytics environments receive this data through daily or hourly batch exports, sacrificing the temporal resolution that makes early-warning detection possible.
Identifying a developing pipe failure requires pressure signature analysis across minutes, not days. Detecting the onset of pump efficiency degradation requires trend analysis across hours of real-time telemetry. Without Azure Service Bus or equivalent streaming architecture bridging operational technology (OT) networks to the analytics layer — while respecting the air-gap security requirements of those OT environments — AI models are operating on historical summaries rather than the signal that actually predicts failure. The detection arrives after the event, which is not detection.
Cross-System Data Alignment — The Reason Non-Revenue Water Is Hard
Non-Revenue Water is water that enters the distribution system and is never billed. Reducing NRW requires correlating production data from SCADA, meter readings from AMI, billing records from Oracle ERP, and spatial distribution network data from GIS — four systems built independently, using different customer identifiers, operating on different update frequencies, and never required to agree on a single source of truth for anything.
The cross-system alignment required to build an effective NRW detection model is not a data engineering nice-to-have. It is the problem. Most utilities that attempt NRW analytics discover that the data integration challenge is larger than the modeling challenge. Without a Master Data Management layer that establishes canonical identifiers — implemented with GUID-based linking for sensitive records — NRW models will detect data inconsistencies rather than actual water losses. The model will be statistically correct and operationally useless.
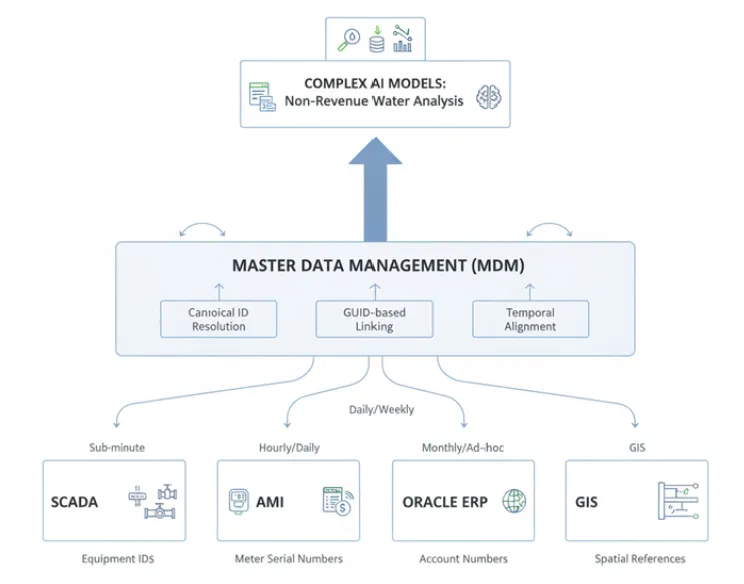 Figure 1: Data from SCADA, AMI, Oracle ERP, and GIS converging through an MDM layer — with canonical ID resolution, GUID-based linking, and temporal alignment — into unified AI model input for Non-Revenue Water analysis.
MLOps — The Gap Between a Model Demo and a Production AI System
Utilities frequently confuse building a predictive model with operating one. Building a model is a data science exercise any competent team can complete in weeks. Operating a model in production — monitoring its performance, detecting drift as infrastructure conditions change, retraining on new data, managing model versions across Azure DevOps, auditing its predictions for the regulatory record — requires a completely different infrastructure and governance posture.
Azure ML with automated retraining schedules, model versioning, performance monitoring, and bias detection is not optional for utility AI. SCADA sensor patterns change seasonally and with infrastructure additions. A pump failure prediction model trained on last year’s fleet composition is not necessarily valid after this year’s capital replacements. Without MLOps infrastructure, models are deployed and forgotten until they fail visibly. When they fail, the failure presents as “AI doesn’t work” rather than “the model was never maintained.”
Self-Service Analytics — The Last Mile That Most Projects Miss
A water utility has thousands of employees. The data engineers and data scientists are a small fraction. The field technicians, customer service representatives, operations supervisors, and department managers who need to act on AI-generated insights are not SQL users. They will not open a Jupyter notebook to query a predictive maintenance model.
Microsoft Copilot integration within Teams, Outlook, SharePoint, and Loop — combined with role-specific Power BI dashboards and conversational analytics interfaces — is what transforms a functional AI system into an organization-wide operational capability. Without the self-service layer, AI investment delivers value to the data team and remains invisible to the operational teams that need it most. The ROI of a predictive maintenance system that only the data team can query is not the ROI of predictive maintenance.
How Traditional Utility Data Platforms Compare
With those requirements established, here is how the systems most utilities already operate compare against them for AI workloads.
| Capability | SCADA Systems | AMI Platforms | Oracle ERP | Legacy BI Tools | Azure Data Platform |
|---|---|---|---|---|---|
| Real-time streaming to analytics | ❌ Operational only — batch export typical | ❌ Hourly/daily batch typical | ❌ Not designed for streaming | ❌ Batch reporting | ✅ Azure Service Bus + Event Hub |
| Data quality governance | ❌ No quality framework | ⚠️ Meter validation only | ⚠️ Financial data quality only | ❌ Consumer of raw data | ✅ Microsoft Purview |
| Cross-system identity alignment | ❌ Equipment IDs only | ⚠️ Meter serial numbers | ⚠️ Customer account numbers | ❌ No MDM capability | ✅ MDM with GUID-based linking |
| ML model deployment and monitoring | ❌ | ❌ | ❌ | ❌ | ✅ Azure ML + MLOps |
| Natural language / self-service AI | ❌ | ❌ | ⚠️ Limited standard reporting | ⚠️ Pre-built reports only | ✅ M365 Copilot + Power BI |
| Regulatory audit lineage | ⚠️ Operational logs only | ⚠️ Consumption records | ⚠️ Financial audit trail | ❌ | ✅ Purview lineage + immutable logs |
Three Failure Modes That Occur in Production
Three concrete patterns that surface consistently when the analytics foundation is not in place before AI development begins:
Failure mode 1 — NRW model that detects data inconsistency, not water loss. A utility trains a Non-Revenue Water detection model on AMI consumption data joined to billing records. The model identifies high-NRW zones with statistical confidence. Field investigation finds no leaks in the flagged zones. Post-mortem reveals that AMI records consumption in local time and billing records use UTC — a six-hour offset during summer — and the model learned to flag the time-zone misalignment as a consumption anomaly.
Failure mode 2 — Predictive maintenance model that degrades silently. A pump failure prediction model is deployed with strong recall on the validation dataset. Six months into production, field technicians report the model is missing failures it previously caught. Investigation reveals two pump stations were upgraded during the period, changing the sensor signature of normal operation. The model was never retrained.
Failure mode 3 — AI investment that never reaches operations. A utility builds and deploys a comprehensive predictive analytics platform: NRW dashboards, asset failure scores, demand forecasting models, power consumption optimization alerts — all technically functional and technically validated. Eighteen months after deployment, 85% of operational staff have never accessed the platform.
The Analytics Readiness Foundation Concept
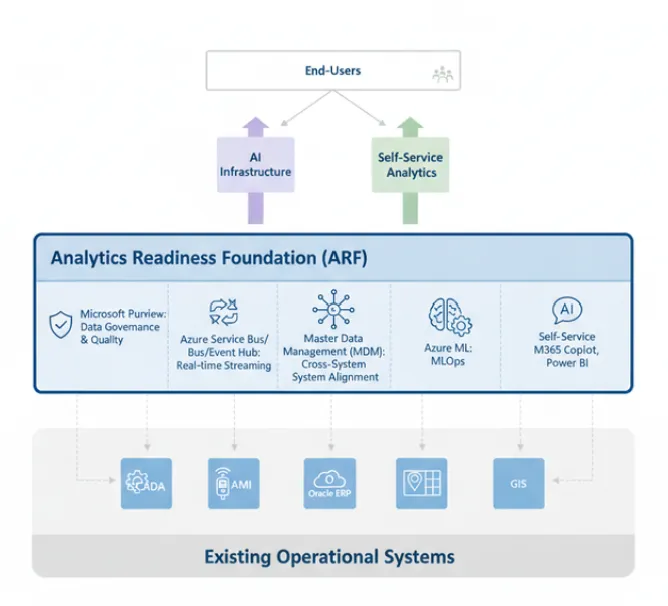
The analytics readiness foundation is a new way to frame what must exist before water utility AI projects can succeed sustainably. It sits in front of existing operational systems, adding the data quality, integration, and delivery capabilities that allow operational data to become the substrate for AI model training and inference.
Figure 2: The Analytics Readiness Foundation (ARF) — layered between existing operational systems (SCADA, AMI, Oracle ERP, GIS) and AI/self-service analytics delivery — comprising Microsoft Purview, Azure Service Bus/Event Hub, MDM, and Azure ML/MLOps.
Data governance and quality enforcement — Microsoft Purview deployment establishes automated data profiling, quality monitoring, lineage tracking, and cataloging.
Real-time streaming integration — Azure Service Bus and Event Hub integration with SCADA systems enables sub-minute data delivery to the analytics layer.
Master Data Management — A canonical identifier system with GUID-based linking establishes the single customer, asset, and location identity.
MLOps infrastructure — Azure ML with automated retraining schedules, model versioning, A/B testing, performance monitoring.
Self-service delivery — M365 Copilot integration within Teams, SharePoint, and Outlook combined with role-specific Power BI dashboards.
The ASCENDING Approach for SAWS
At ASCENDING Inc., these are the gaps that shaped how we designed our response to the San Antonio Water System’s Data Analytics and Artificial Intelligence Services RFP (R-25-006-RL). Our six-person core team — supported by Texas GovLink, Inc. (HUB/MBE/SBE certified, 15% participation) and DATA FLUXUS LLC (HABE/MBE/SBE certified, 10% participation) — approaches the SAWS engagement as an analytics readiness problem first and a model-building problem second.
ASCENDING is a minority-owned small business headquartered in Fairfax, Virginia, with active delivery for the City of Phoenix Water Services Division and multiple State of Texas master contracts.