Customers pay more and more attention to their cloud bill and usage these days. Today one can launch thousands of instances on AWS to complete a computing job that took years in the past. But one can also launch hundreds of instances sitting in idle. Most of our customers “Lift and Shift” their IT infrastructure to AWS at the beginning. They choose gradually to not only optimize the cost but also improve the elasticity in the cloud later. They may have done right-sized their EC2, purchased reserve instances or moved away some computing power to spot instances. Perhaps they have replaced an existing service with an AWS managed service or dedicated dev-ops effort to write infrastructure as code. However, they may not have had a way to quantify or measure the cost optimization on AWS whether the approach taken was successful or not. How to measure cost optimization is a critical part in the chain.
We will talk about a few key metrics to measure cost optimization effort for our customer. We thought it’d be helpful when you decide to optimize your cloud spending, which should be pretty soon.
Cost Optimization
First thing first, we need to put together a plan for cost optimization. We have talked about various ways of optimizing cost in AWS. Here are some practical cases.
Scenario 1: Customer only use EC2
It’s a phenomenon that enterprises “Lift and Shift” their IT infrastructure to AWS and getting a large sum of EC2 bill every month. When we work with these customers, we usually find lots of room for cost optimization.
- Spot – We recommend off-load some computing to spot instances.
- Lambda – Some scheduled jobs can be handled by lambda.
- Managed Services – We also find the possibility of moving services to AWS managed services.
These are pretty generic recommendations. For instances, we found lambda is especially cost effective to complete certain jobs if we can break them down into pieces and make them false tolerant. Because it’s serverless, which AWS manage the availability for you. Another example, we can replace memory cache or Redis with ElastiCache service with only a few configuration code changes. We will not only improve elasticity but also reduce operation cost and EC2 costs. Same applies to migrating on-premise database to RDS, CI servers to Codepipeline etc.
Scenario 2: Customer can’t effectively manage multiple environments.
They have already used various service in AWS. This type of customer usually have lots of environments for each product and very hard to oversee all. We help them implement infrastructure as code to effective manage those environments such as using cloudformation to automate their entire stack on AWS, using puppet to manage OS level provision. By doing that, anybody in the team can switch on/off any environment with just a click. It’s even possible to spin up extra environment within 30 minutes for a particular sales call. It helped customer eliminate idle computing power on cloud.
Scenario 3: Customer is looking to optimize architecture
This is more custom topic for specific customer. We have talked about turning entire stack into micro service dockerize container, we have also talked about how to optimize specific AWS service like S3 storage.
Measure Cost Optimization
After all cost optimization effort, it’s important to know if it has really worked. By working with several customers, we found a few key metrics are essential for them to measure cost optimization.
Computing Hrs/Cost Composite Metrics
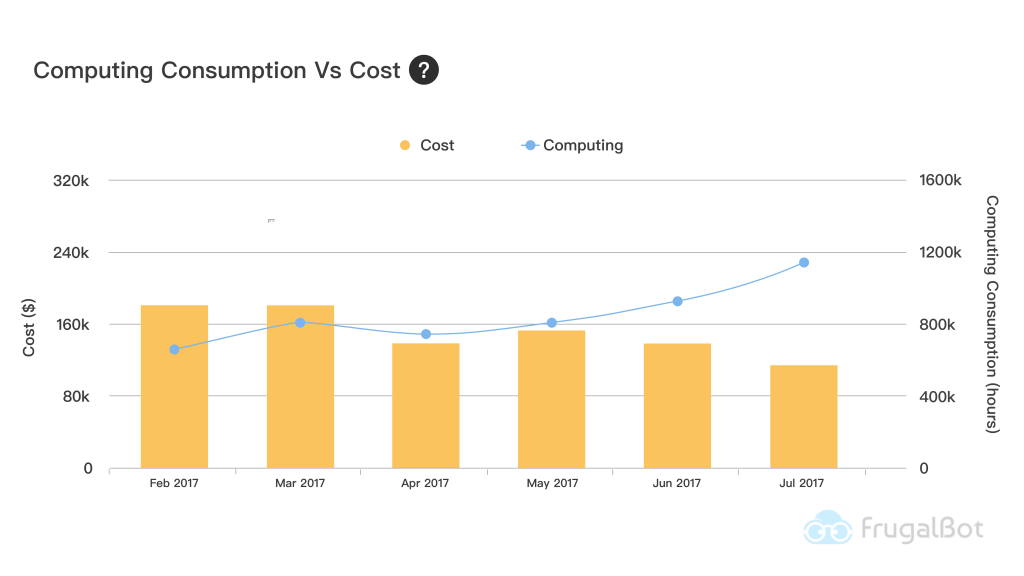
It is sometime rather difficult to measure cost optimization effort by cost index. Let’s image a company with IT infrastructure growing each month, we can’t measure just by cost alone. Because finance guy will soon find out no matter how hard you work, the cost would have stayed same or outnumber last month. We found a slightly different approach to tell the story, which computing hours/cost composite metrics.
It fits perfectly to most generic scenarios within a quickly IT expansion enterprise. This is how we read the metrics for above 3 scenarios
- For Scenario 1 – Even thought the cost has stayed the same or slightly up month after month, but the computing hours has increase 20-30% from cost optimization effort. We have essentially saved 20-30% cost on EC2.
- For Scenario 2 – Customer should see computing hours and cost drop from time to time, because they turn on environments only when they are needed.
- For Scenario 3 – Customer should see cost drop but computing hours almost static.
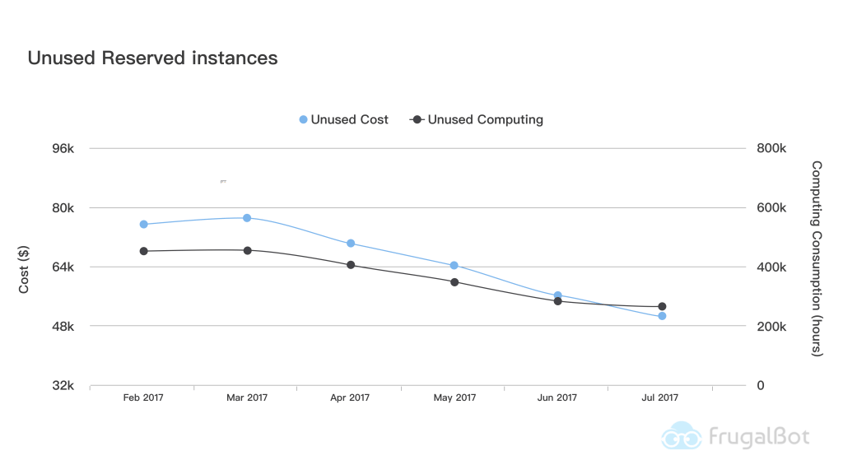
Unused Reserved Instance Metrics
In an ideal situation, customer should see their unused reserved instance go down month over month. Someone has to be notified vice versa. We suggest to revisit this metrics each month or bi-weekly.
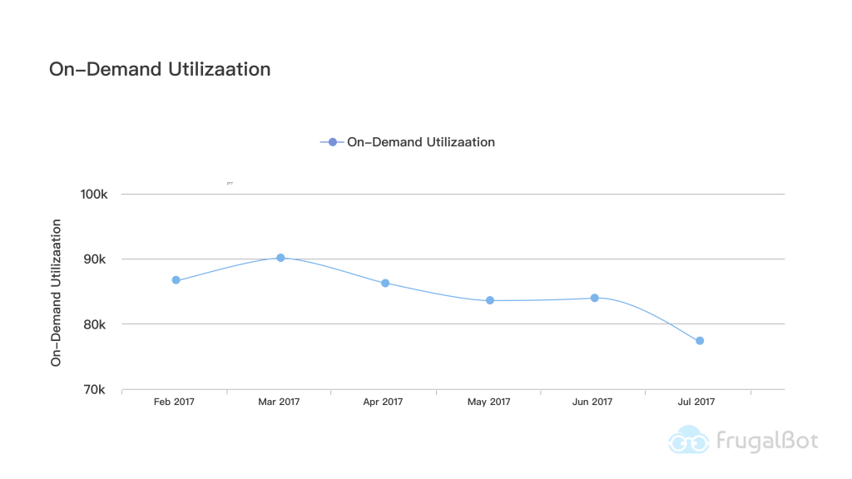
On-Demand Usage Trend
On-demand computing hours shouldn’t spike in an ideal world, it should be flat most of time. Same as unused RI metrics, we recommend to revisit this metrics each month or bi-weekly.
Reserved Instance Recommendation Tool
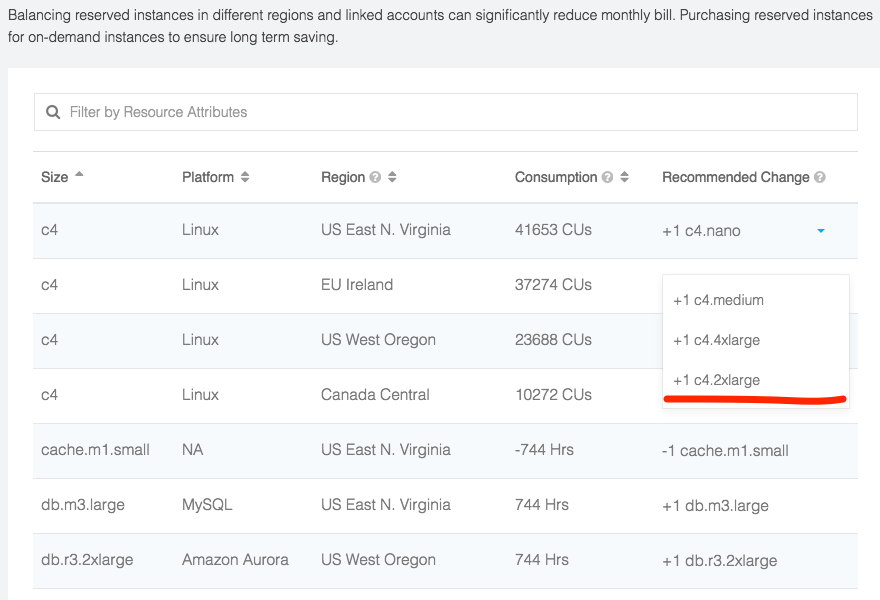
From 2017 Mar, Linux reserved instance rule has changed again. Why do we use the word “again”… AWS is enthusiastic about getting best value to their customers. All of our customers has previously opt-in regional RI for flexibility. Now they no longer have to worry about instance type because RI will automatically be applied by family and computing unit. Long story short, if you have one m4.2xlarge instance , it can cover one m4.2xlarge instance or two m4.xlarge instance running in that region and so forth 4 m4.large … You can refer to the AWS post for more information.
The new rule gives lots of room to improve reserved instance purchase process. In the past, it’s one to one map purchase in a sense customer purchase a m4.2xlarge RI for one running m4.2xlarge instance. As we know, lots of advance AWS customer has dynamic running instances in their account each month. Sometime 2xlarge instance will be stop, and then xlarge and large instance will be launched instead. Other time a 4xlarge instance will be launched to handle intense job. The average running computing unit is probably a combination of one 2xlarge,xlarge,medium plus nano instance rather than one 4xlarge instance.
The better approach is to tally that particular instance family usage in last period(month) and figure out optimum purchase plan for current month RI purchase. Of course, it will be more bullet proof if you use Unused Reserved Instance Metrics,On-Demand Usage Trend to measure after purchasing.
Continuous Cost Optimization
We are essentially renting service from AWS, who constantly Re:Invent a new way to host IT infrastructure. This is the best part of “pay you go” model, we don’t have to commit one architecture all the time. Sometime there are better way and technology to distribute application on the cloud. Sometime we have to terminate servers are running idle. There are so many ways to optimize your stack on cloud.
For example, we have evolved a service from static server to stateless in autoscaling group, then to container service on spot instances. Now we are working on serverless proof of concept. We enabled measurement in each optimization cycle. Frankly, this is a lot easier for our client to gain confidence and for us to conduct work. They can tell they cut 50% cost from metrics immediately.
This is why FrugalOps team has released FrugalBot version 2 to AWSMarket place. It helps you measure your cost optimization effort with above critical metrics and other more. We purpose a healthy loop for every team who would like drive cloud spending low, optimize->measure->optimize, which is our concept of Continuous Cost Optimization mentioned in the very first blog. With the help of key-metrics insight, you will be amazed how much you have done throughout journey!
