Read Time 5 mins | Written by: Daoqi | Celeste Shao
Kubernetes Cost Monitoring involves tracking and analyzing expenses associated with running applications and services on a Kubernetes cluster. As organizations adopt Kubernetes to manage containerized workloads at scale, they face the challenge of increased infrastructure costs. Cost monitoring in Kubernetes aims to optimize resource utilization and reduce operational expenses by providing valuable insights into resource consumption and associated costs.
Available Solutions
Various commercial Kubernetes cost monitoring solutions are available, offering integration with major cloud providers like AWS, Google Cloud, and Azure.
KubeCost
Kubecost, a real-time cost monitoring tool, is tailored for teams leveraging Kubernetes. It offers customizable cost allocation, precise showbacks, chargebacks, and continuous resource monitoring. With a unified view of Kubernetes and out-of-cluster spending, integrated with cloud service billing data, users receive personalized optimization recommendations based on their usage patterns.
DataDog
Datadog's Cloud Cost Management now extends support to EKS, ECS, and Kubernetes in AWS. Users can allocate costs, efficiently manage shared resources, and gain detailed insights into container expenses and platform cost attribution.
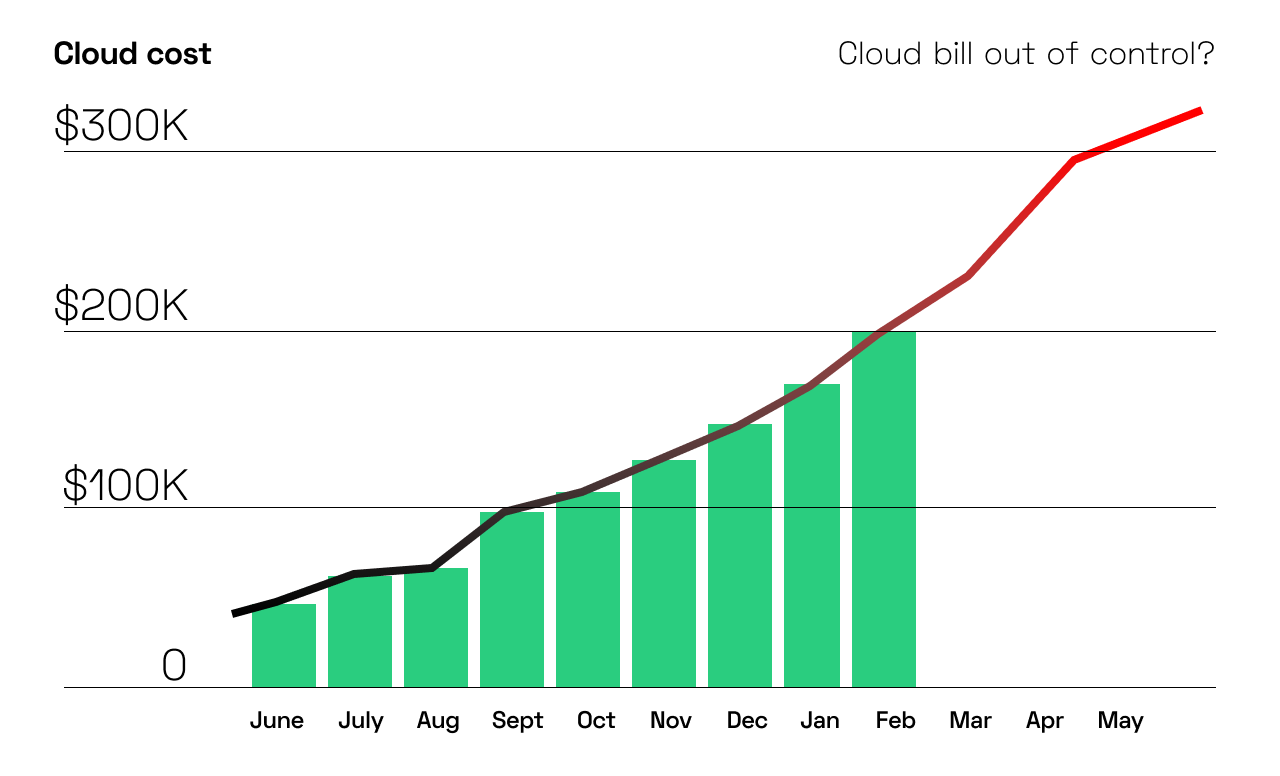
The Challenges
Most Kubernetes cost monitoring products provide a global cost monitor for resources inside and outside Kubernetes, relying on cost and usage reports generated by cloud providers. This often results in a delay of 24-48 hours before the data is available, making it inefficient for real-time development needs. Moreover, some tools provide default prices for vCPU and memory before the actual cost report, which can be inaccurate. Additionally, cost breakdowns are limited to the container level, requiring manual effort to group containers for specific workloads.
The ASCENDING Approach
ASCENDING introduces a customizable approach to Kubernetes cost monitoring and estimation for specific workloads, such as Spark jobs.
The logic behind customized spark cost monitoring
For Spark jobs running on EKS, EC2 instances are utilized for Spark driver and executor pods. To calculate the total cost of each Spark job run, the number of pods used, pod runtime, and pod price per hour must be determined. The cost model for each pod is calculated as follows:
Runtime of the pod(hrs) * Price of the pod($/hr) = Cost of the pod($)
For a spark job, there will always be a spark driver pod generated in the EKS cluster. By locating this driver pod, we can find all executor pods created by this driver during the spark job. With the pod metrics, we can know which nodes the pods are running on. Using the node ID, we can get information like: node instance type, availability zone, and capacity type. With all this information, we can retrieve the price data from AWS API, either spot instance price data or on-demand instance price data.
The real-time price data retrieved from AWS is on a node bases, which means we can calculate the Price of the pod by following the formula:
(Price of the node($/hr) / Total vcpu of the node) * vcpu requested by the pod = Price of the pod($/hr)
Main components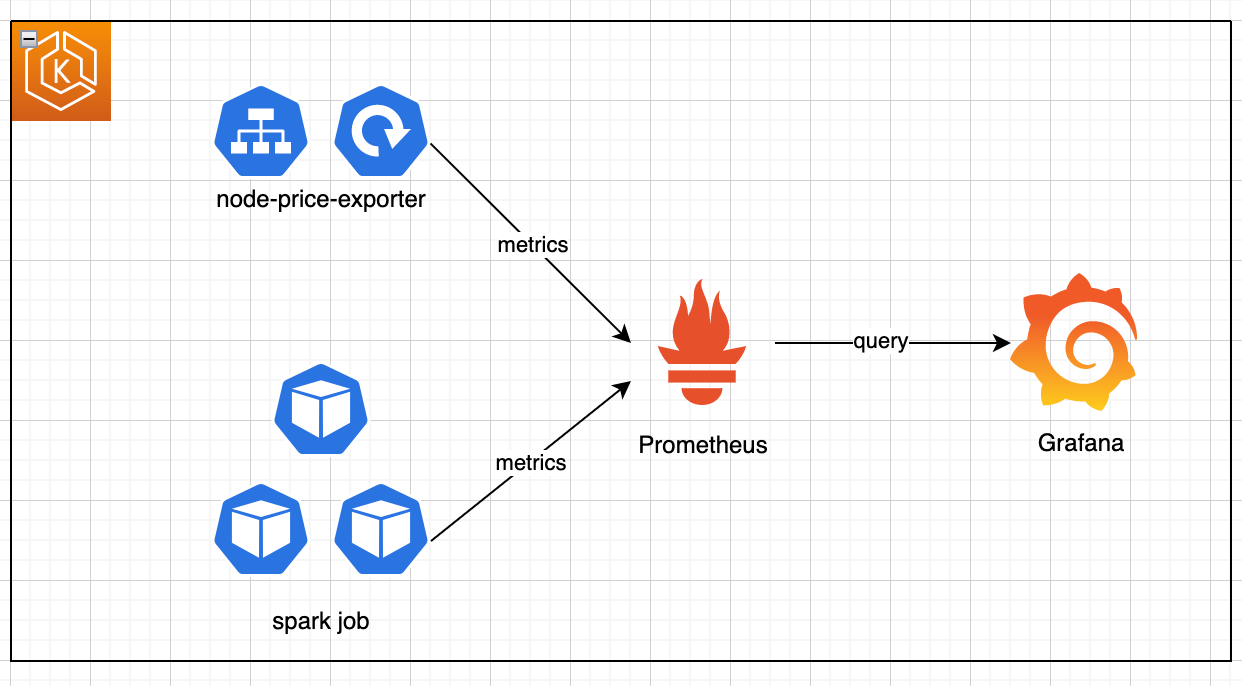
This customized spark cost monitoring solution contains three main components:
Custom node-price-exporter
We create a customized node price exporter using Prometheus library. The exporter will perform following tasks on a pre-defined frequency:
-
Get current nodes inside the Kubernetes cluster
-
Retrieve node price from AWS API using node instance type, availability zone and capacity type information get from step 1.
-
Combine the node price and node info into Prometheus metrics format and publish the metrics to port 8080.
The node price exporter will be deployed in EKS as a Kubernetes deployment and exposed as Kubernetes service. IRSA is used to authorize this node price exporter pod to describe spot history price and EKS node information.
# Deployment Yaml
apiVersion: apps/v1
kind: Deployment
metadata:
  name: node-price-read-only
  namespace: monitor
  labels:
    app: node-price-read-only
spec:
  replicas: 1
  selector:
    matchLabels:
      app: node-price-read-only
  template:
    metadata:
      labels:
        app: node-price-read-only
    spec:
      serviceAccountName: node-price-read-only
      containers:
      - name: node-price-read-only
        image: <image for node-price-exporter>
        imagePullPolicy: Always
        ports:
        - containerPort: 8080
---
apiVersion: v1
kind: Service
metadata:
  name: node-price-read-only
  namespace: monitor
  labels:
    app: node-price-read-only
spec:
  type: ClusterIP
  selector:
    app: node-price-read-only
  ports:
    - name: web-node
      port: 5000
      targetPort: 8080
Prometheus Operator
The Prometheus Operator provides Kubernetes native deployment and management of Prometheus and related monitoring components. A core feature of the Prometheus Operator is to monitor the Kubernetes API server for changes to specific objects and ensure that the current Prometheus deployments match these objects. We use the ServiceMonitor Custom Resource Definitions (CRDs) acted by Prometheus Operator, to monitor the node-price-exporter service. This gives Prometheus the capability to scrape metrics from a Kubernetes service without hardcoding the pod IP address.
A Prometheus deployment that collects EKS metrics from `metrics-server` and `kube-state-metrics` is also included in Prometheus Operator. The deployment configuration will be customized to scrape metrics from node-price-exporter service and relabel any necessary metrics.
extraScrapeConfigs: |
  - job_name: 'node_price'
    scrape_interval: 2m
    scrape_timeout: 1m
    metrics_path: /metrics
    static_configs:
      - targets:
        - <servicename>:8080
Grafana Dashboard
The Grafana dashboard is where the visualization happens. We deploy a Grafana Helm Chart with Prometheus as default datasource. A pre-defined customized Grafana dashboard will be imported with the helm chart installation.
The Grafana dashboard looks like the following image, it has a drop-down list where you can choose from all spark job using the spark-driver name. On the left side, there’re four panels showing the total number of instances used for the spark job( includes spot instances which terminated before the job finished), the job duration, the total number of job runs in current namespace and the total cost of the selected spark job. On the right, it shows all the executor pods created/used during this selected spark job.
If you would like to explore best practices on Prometheus and Grafana, please check out another blog here.