
-
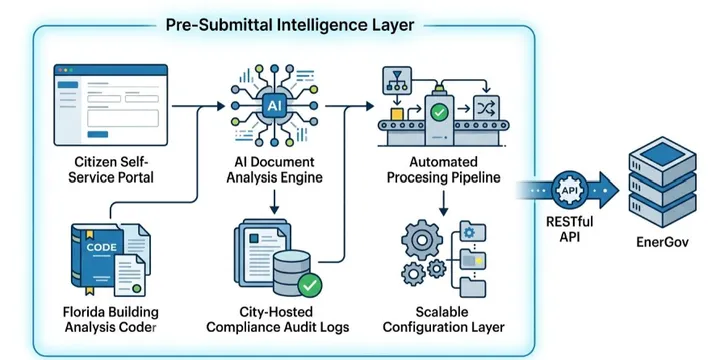
Municipal Permit AI: Five Capabilities of a Production-Ready Completeness Platform
-
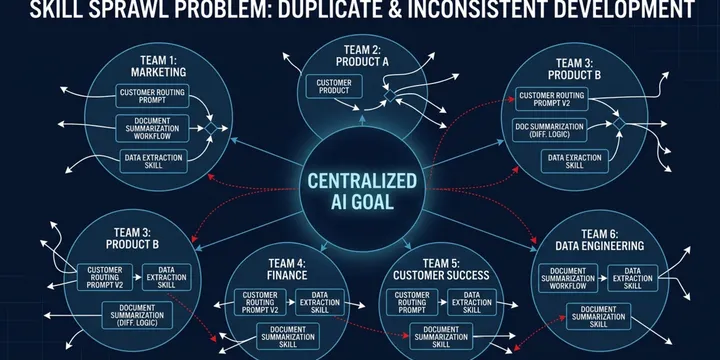
The Case for Private, Organization-Level Skill Management in AI Teams
-
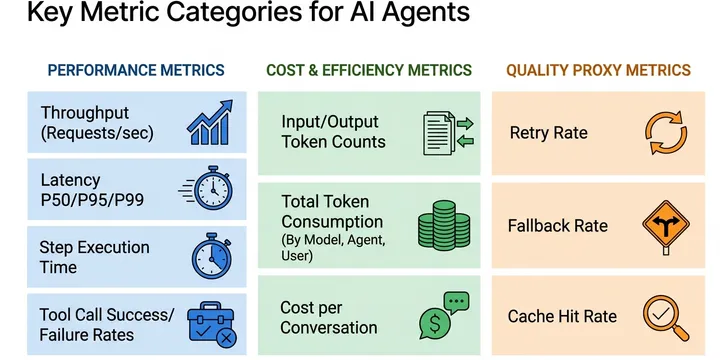
OTEL Observability for AI Agents: Traces, Logs, and Metrics Explained
-
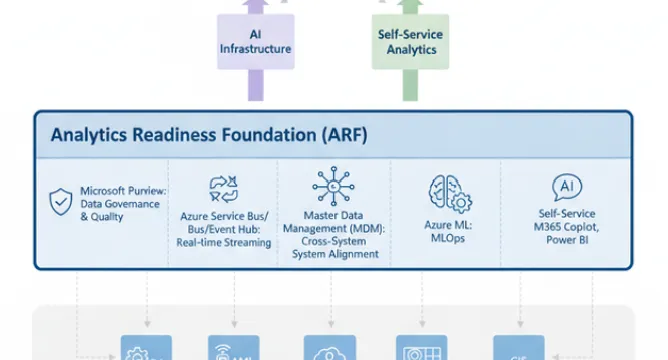
Water Utility AI Transformation: Closing the Analytics Readiness Gap
-
_Z22gJsn.webp)
Understanding QuickSight Scheduled Email Exports
-
Kubernetes Secrets and Pod Restarts: How to Reload Secrets Safely
-

Kubernetes Graceful Shutdown for Celery: Protect Long-Running Jobs from SIGKILL
-

The Hidden Limitations of NAT Gateways
-

Cloud Storage Solution Deployment Instruction
-

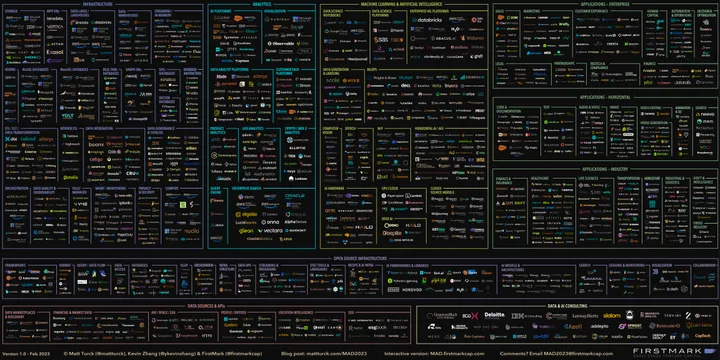
Navigating the MLOps Landscape: Choosing Your Path
-

Crafting Custom AI Solutions: A Success Story
-

Evolving Machine Learning Operations: Mastering CI/CD Pipeline Automation
-
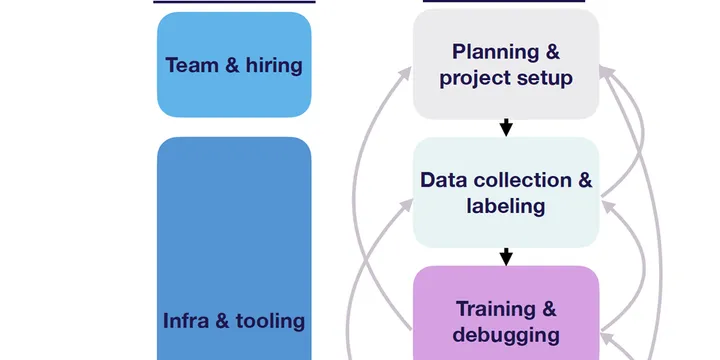
Navigating the Complex Terrain of Machine Learning Operations: A Dive into MLOps
-
Cost Factors and Challenges in Machine Learning Projects: A Comprehensive Guide
-
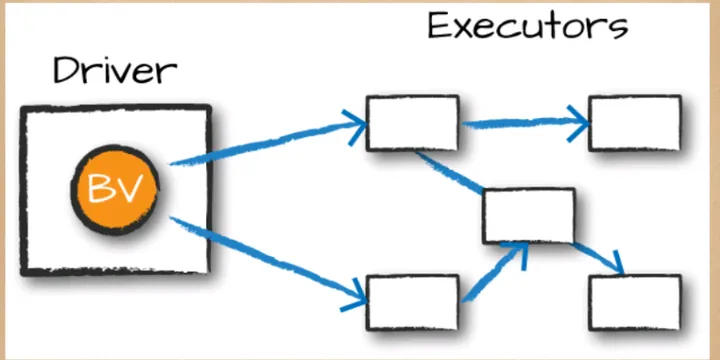
Spark in Amazon EKS Kubernetes - Unlocking Efficiency through Broadcasting in Spark
-

How Inefficient IT Hiring Saps Your Business's Potential
-
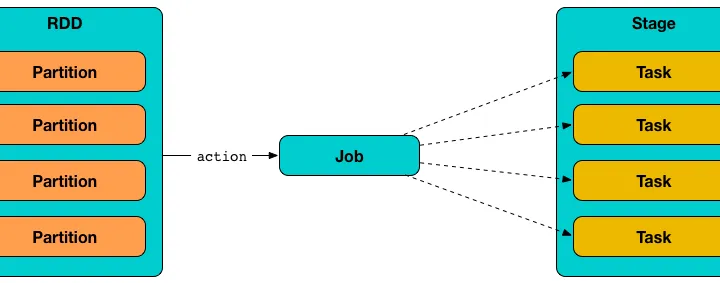
Spark in Amazon EKS Kubernetes - Partition Optimizations
-
Spark in Amazon EKS Kubernetes - Eliminate the Performance Inefficiency of Union Operator
-
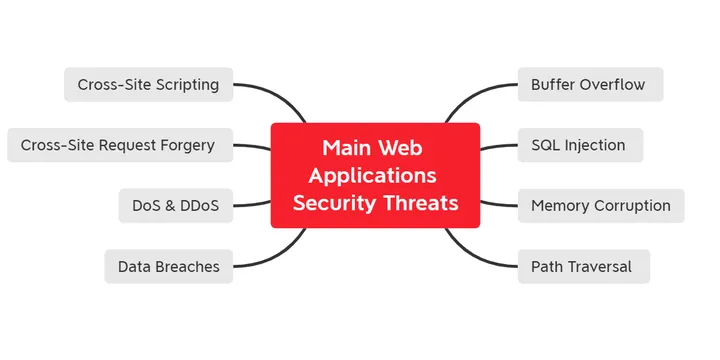
AWS WAF,Shield, Firewall Manager - Secure Web Apps Just 1-Click
-

Interactive Spark Mode on EKS Cluster - Debugging and Troubleshooting
-

EKS Best Practice - Cost Monitoring per Workload
-

AWS Scale-Out Compute Architecture: Harnessing the Power of HPC in the Cloud
-

Human Fight with AI - The Challenge of Identifying Authentic Candidates in the Age of AI
-

A Quote of $5k vs $500k - How to Choose the Right IT Vendor
-
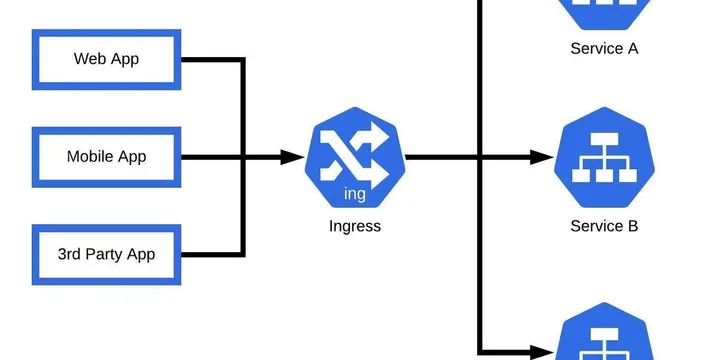
EKS Best Practice - Optimize and Secure Ingress Rule in EKS Cluster
-
EKS Best Practice - Kubernetes Secrets Management Part II
-
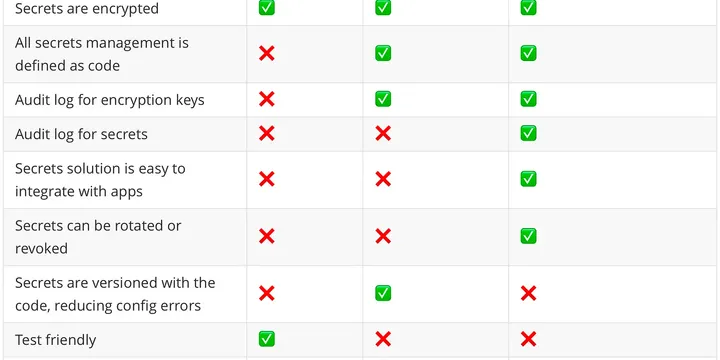
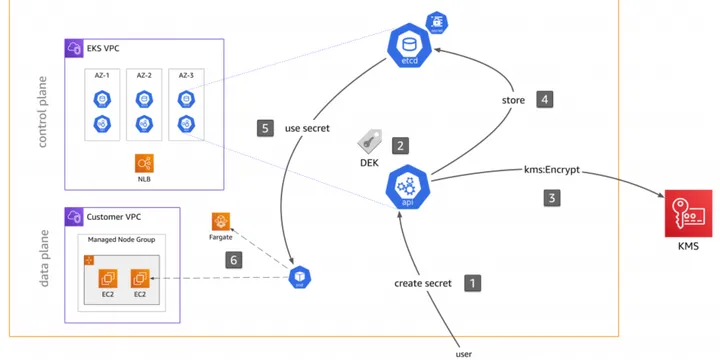
EKS Best Practice - Store Secrets for Sensitive Data(Kubernetes Secrets Management)
-
Migrating DB Schema to DynamoDB: Design Process and Access Pattern
-
EKS Best Practice - Monitoring with Prometheus and Grafana
-
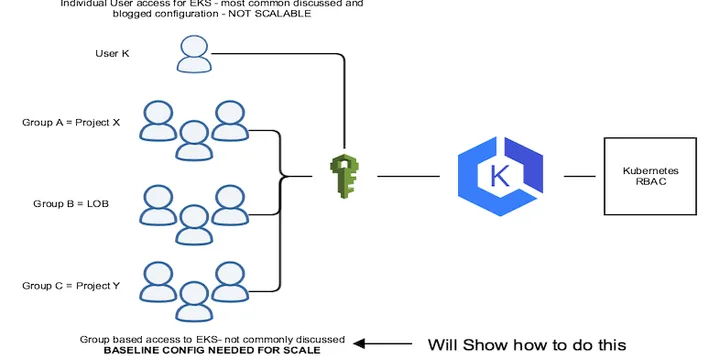
EKS Best Practice - Authentication & Authorization
-
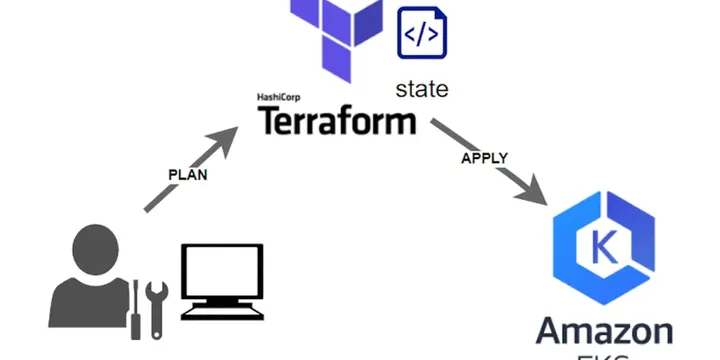
EKS Best Practice - Infrastructure As Code Using Terraform
-
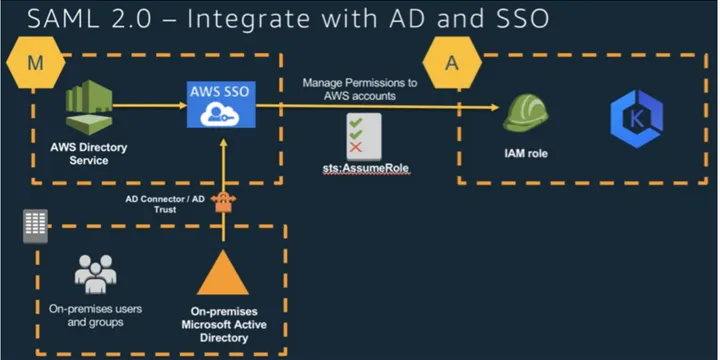
EKS Best Practice - SSO Integration
-
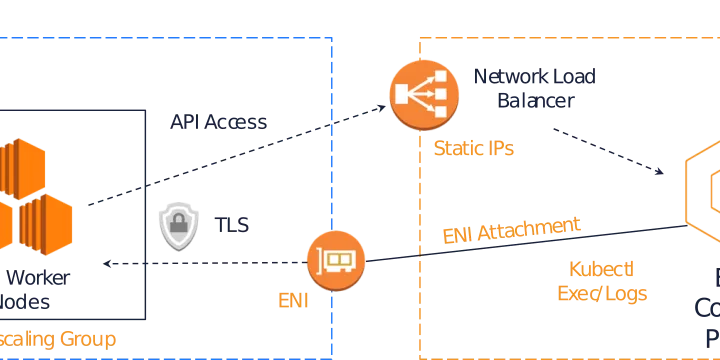
EKS Best Practice - Networking
-

A Journey to AWS Cloud Continuous Cost Optimization (CCO)
-
A Quick Tutorial of SpringBoot with WebSocket Capabilities
-
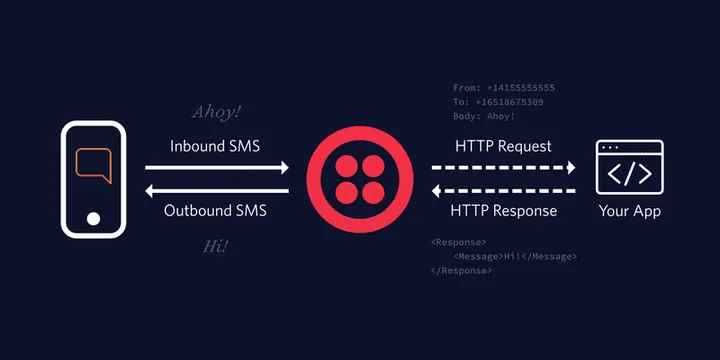
AmazonSQS Third Party Integration with Twillio SMS
-

AWS Lambda Runtime Compatibility Issue on Native Library
-
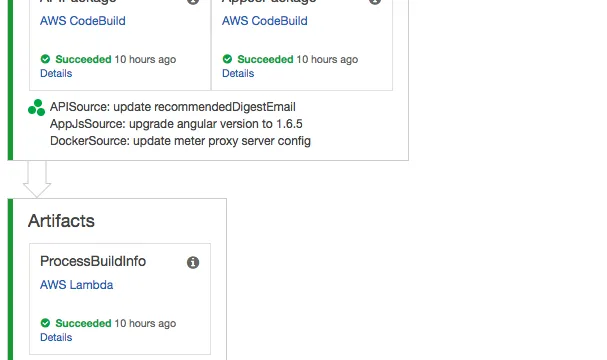
CI and CD with AWS CodePipeline, CodeBuild and CloudFormation – Part 1 | Continuous Integration & Continuous Delivery
-
Continuous Deployment on Kubernetes Platform using AWS CodePipeline
-
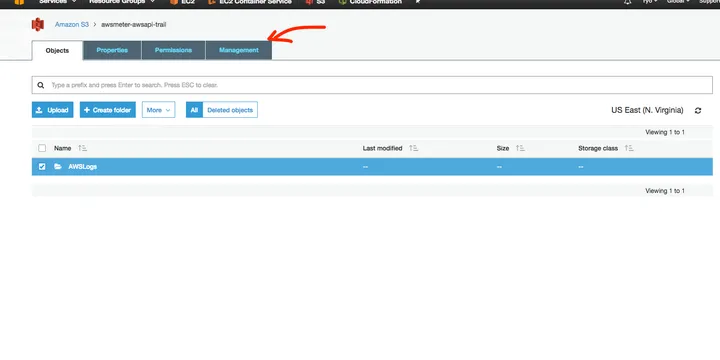
Cost Optimization S3 (AWS Storage) – Simple way to reduce S3 cost without code change
-
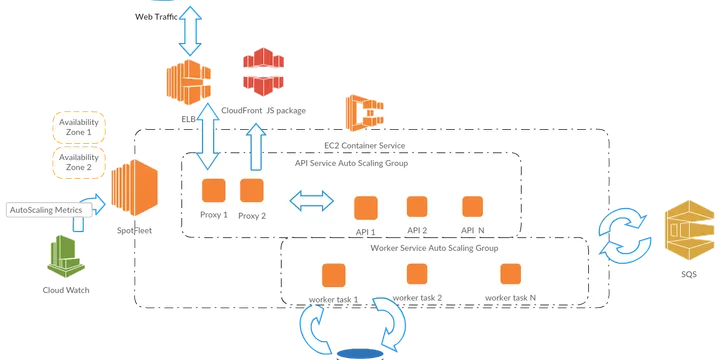
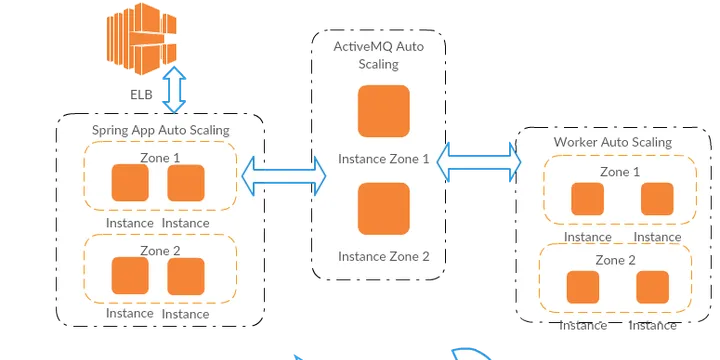
Cost Optimization Spot Fleet + AutoScaling and High Availability
-

How to integrate Redis with SpringBoot
-
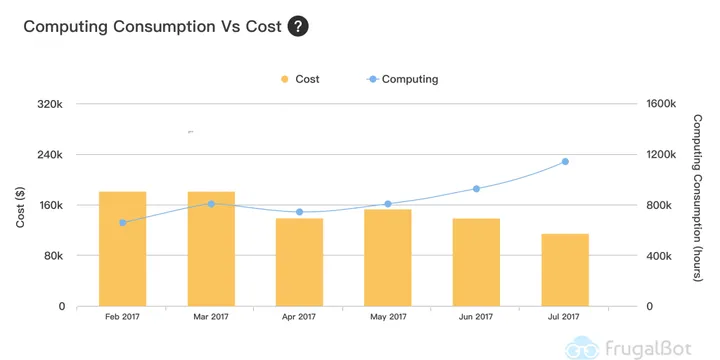
How to Measure Cost Optimization on AWS
-

Integrate Amazon SQS and SendGrid with SpringBoot Application
-
Migrating Business Applications Using Serverless Computing
-

Passing Resources in Nested Cloudformation
-
Programmatic Cloudformation Template
-
Running your stack on Spot Instance
-

Spot Instance 2 minutes termination
-
Spring: Quick Tutorial to Integrate Amazon S3 Presigned URL
Jarvis AI
>
Talent Solutions
>
Public Sector
>

Contract Vehicles
Department of Information Resources of TexasUniversity of ArizonaVirginia Association of State College and University Purchasing Professionals (VASCUPP)Louisiana Division of AdministrationFlorida Department of Management ServicesBaltimore County Public Schools IT Staffing ServicesThe Interlocal Purchasing System (TIPS) Technology Solutions, Products, and ServicesThe Interlocal Purchasing System (TIPS) data Analytics, Solutions, and Services