Challenge-Secure Ingress Rule:
In a large-scale Kubernetes(k8s) cluster or Amazon Elastic Kubernetes Service(EKS), often time we have to manage a large set of ingress rules such as different application environments, internal monitoring service, etc. There are a lot of benefits to consolidating those ingress rules:
-
It simplifies networking configuration, as multiple Ingress rules or Application Load Balancers(ALB) can introduce complexities in managing networking rules and policies. Consolidating into a single ALB reduces the number of resources to manage and simplifies the ingress configurations for the cluster.
-
It optimizes cost by reducing the number of ALBs needed, as ALBs are charged based on their usage. E.g. dev/test/staging can share one single ALB, and all internal services can group together in another ALB.
-
It improves security by reducing the number of entry points into the cluster. With a single ALB, there are fewer exposed endpoints, reducing the attack surface and making it easier to implement security measures.
-
It improves performance by consolidating traffic through a single ALB, reducing the overhead of managing multiple ALBs and providing a unified entry point for traffic routing and load balancing.
The ASCENDING Approach
What is ingress service?
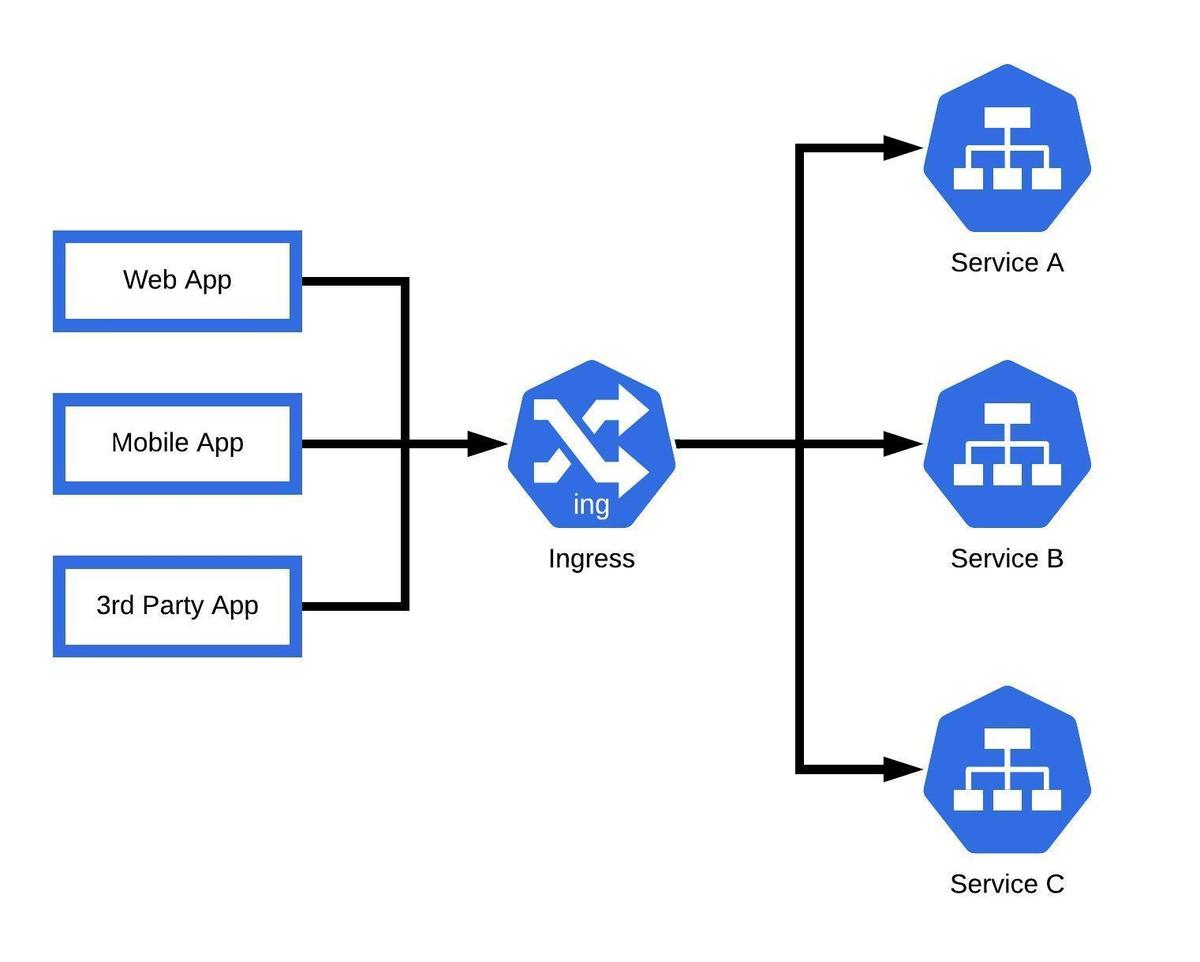
Ingress exposes HTTP and HTTPS routes from outside the cluster to the services within the cluster. Traffic routing is controlled by rules defined on the Ingress resource.
In Kubernetes, a Service is an abstraction that defines a set of Pods and provides a stable IP address and DNS name for accessing those Pods. Services in Kubernetes are used to expose applications running on Pods to the network, both within the cluster and externally.
An Ingress in Kubernetes is an API object that defines rules for how external traffic should be routed to Services within the cluster. It acts as a gateway for incoming traffic from outside the cluster to reach the appropriate Services running inside the cluster.
The solution:
-
Make sure to install the AWS ALB ingress controller if you decide to create an ingress on your EKS cluster: https://docs.aws.amazon.com/eks/latest/userguide/aws-load-balancer-controller.html
-
Define ingress configuration: Create ingress resources that define the routing rules for your workloads. An ingress resource typically includes rules that specify the hostnames, paths, and backends for routing traffic to the appropriate services or pods.
-
In order to group all the ingress workloads to share the same ALB, make sure to include this annotation in each of your ingress yaml file with the same group name:
alb.ingress.kubernetes.io/group.name: <"The group name">IngressGroup
IngressGroup feature enables you to group multiple Ingress resources together. The controller will automatically merge Ingress rules for all Ingresses within IngressGroup and support them with a single ALB. In addition, most annotations defined on an Ingress only apply to the paths defined by that Ingress.
alb.ingress.kubernetes.io/group.name specifies the group name that this Ingress belongs to.
Reference link for all the annotations for ALB : https://kubernetes-sigs.github.io/aws-load-balancer-controller/v2.2/guide/ingress/annotations/#group.name
If you want to use custom domain names for your services, you'll need to update your AWS Route 53 to point to the DNS name of the ALB. This will route incoming traffic from the internet to the ALB, which will then route it to the appropriate services or pods based on the ingress rules.
The example
Here is an example showing how to group the Prometheus and Grafana services into the same ALB in the EKS cluster, which are the services we have talked in the last blog to monitor your EKS clusters.
Sample ingress yaml file for Grafana and Prometheus:
  ---
  apiVersion: networking.k8s.io/v1
  kind: Ingress
  metadata:
    name: monitor-app-ingress-prometheus
    namespace: monitor-services
    labels:
      app: monitor-app
    annotations:
      kubernetes.io/ingress.class: alb
      alb.ingress.kubernetes.io/group.name: "monitoring"
      alb.ingress.kubernetes.io/ssl-redirect: '443'
      alb.ingress.kubernetes.io/healthcheck-path: '/'
      alb.ingress.kubernetes.io/listen-ports: '[{"HTTP":80}, {"HTTPS":443}]'
      alb.ingress.kubernetes.io/scheme: internet-facing
      alb.ingress.kubernetes.io/ssl-policy: "ELBSecurityPolicy-TLS-1-2-Ext-2018-06"
      alb.ingress.kubernetes.io/target-type: ip
      alb.ingress.kubernetes.io/healthcheck-protocol: HTTP
      alb.ingress.kubernetes.io/healthcheck-port: traffic-port
      alb.ingress.kubernetes.io/healthcheck-interval-seconds: '15'
      alb.ingress.kubernetes.io/healthcheck-timeout-seconds: '5'
      alb.ingress.kubernetes.io/success-codes: 200-499
      alb.ingress.kubernetes.io/healthy-threshold-count: '2'
      alb.ingress.kubernetes.io/unhealthy-threshold-count: '2'
      alb.ingress.kubernetes.io/certificate-arn: "arn:aws:acm:us-east-1:xxxxx:certificate/xxxx"

  spec:
    rules:
      - host: prometheus-test.ascendingdc.com
        http:
          paths:
            - backend:
                service:
                  name: monitor-prometheus-server
                  port:
                    number: 80
              path: /
              pathType: Prefix
      - host: grafana-test.ascendingdc.com
        http:
          paths:
            - backend:
                service:
                  name: monitor-grafana
                  port:
                    number: 80
              path: /
              pathType: Prefix
Code Explanation
spec:
  rules:
  - host: prometheus-test.ascendingdc.com
...
  - host: grafana-test.ascendingdc.com
The ingress rules will apply to each of the specified host.
alb.ingress.kubernetes.io/ssl-redirect: '443'
...
alb.ingress.kubernetes.io/listen-ports: '[{"HTTP":80}, {"HTTPS":443}]'
...
alb.ingress.kubernetes.io/certificate-arn: "arn:aws:acm:us-east-1:xxxxx:certificate/xxxx"
Set the listener rule to redirect to HTTPS: 443 from HTTP:80.
Make sure to include the HTTPS:443 in the listen-ports annotations as well as the corresponding SSL certificate to use.
http:
  paths:
    - backend:
        service:
          name: monitor-prometheus-server
          port:
            number: 80
      path: /
      pathType: Prefix
...
http:
  paths:
    - backend:
        service:
          name: monitor-grafana
          port:
            number: 80
      path: /
      pathType: Prefix
Specify the listener rules to route the traffic from different host to the corresponding backend services.
Jordan.X
Cloud Engineer @ASCENDING
Ryo Hang
Solution Architect @ASCENDING
Celeste Shao
Data Engineer @ASCENDING