

What State Medicaid Fraud Detection Systems Are Missing: Lessons from a Tennessee Pharmacy Fraud Pilot
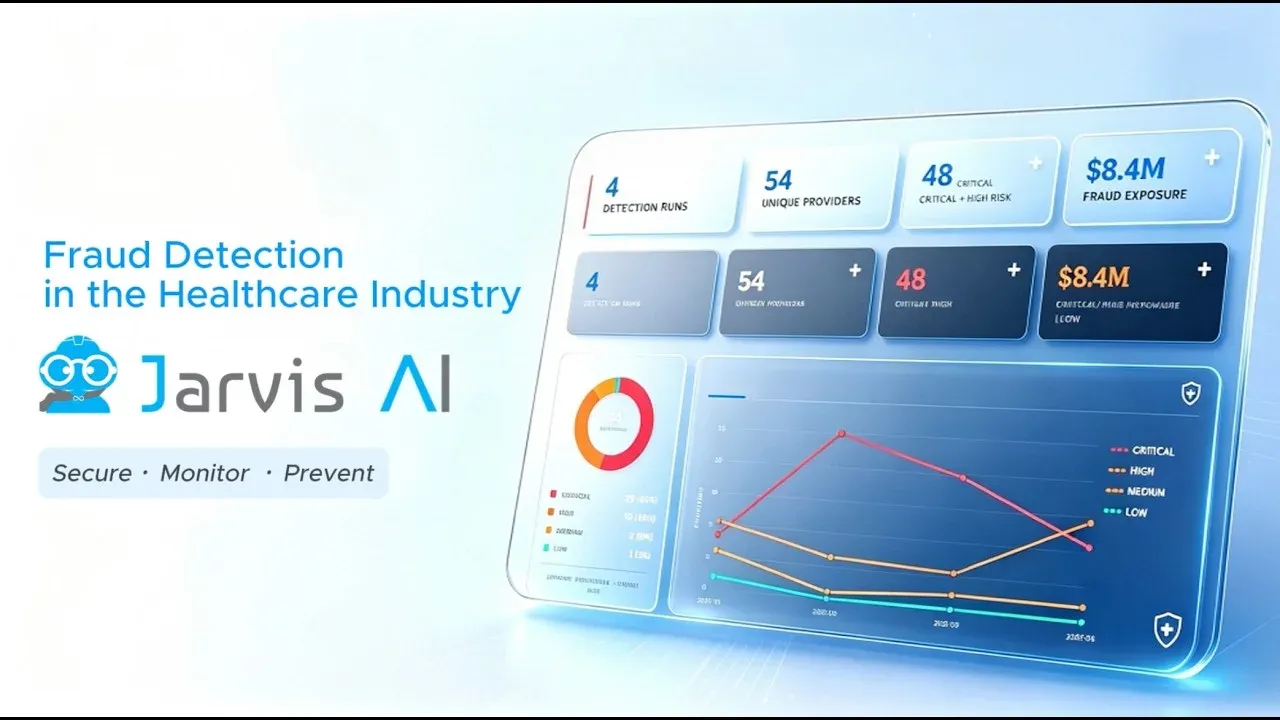
Watch the demo: See how the Jarvis AI fraud detection pilot works in practice — from surfacing high-risk providers to comparing run-to-run changes and supporting investigator review.
Every state Medicaid program faces the same uncomfortable reality: fraud is often found after the damage has already occurred. A tip, audit, or whistleblower complaint may eventually expose the issue, but by then the provider may have billed for months or years, patients may have been exposed to unnecessary prescriptions, and the state is left trying to recover money instead of preventing the loss.
In a pilot we ran against one year of Tennessee CMS Part D pharmacy claims data, Jarvis AI identified 48 providers exhibiting fraud-consistent patterns severe enough to warrant investigation. Eight of those providers were already excluded from federal healthcare programs yet still appeared in active claims data.
That does not mean existing Medicaid program integrity teams are failing. States already use surveillance utilization review, cross-reference the OIG List of Excluded Individuals and Entities, and rely on Medicaid Fraud Control Units (MFCUs) to pursue referrals. The problem is that most systems still lack the connective tissue between detection and action: peer comparison, dollar impact, referral logic, and a workflow that tracks what happens after a provider is flagged.
Our Tennessee pharmacy fraud pilot surfaced five capability gaps that matter for any Medicaid program using structured claims data.
The Five Signal Categories Behind Pharmacy Fraud Detection
Before a system can prioritize fraud risk, it needs signals worth acting on. In our pilot, the strongest fraud-consistent patterns came from five categories:
| Signal Category | What It Measures | Example From the Pilot |
|---|---|---|
| Peer Deviation | Provider opioid rate versus same-county, same-specialty average | A general surgeon in Lincoln County prescribed opioids at 22 times the county average |
| Statistical Outliers | Z-score distance from peer group across multiple dimensions | An endocrinology provider showed a 9.04 opioid-rate z-score despite a low absolute opioid rate |
| Temporal Anomalies | Year-over-year growth in opioid claims or payments | A physician assistant’s opioid claims grew 8,050 percent year over year |
| Financial Conflict of Interest | Pharmaceutical payments concurrent with elevated prescribing | An orthopedic surgeon received $87,181.94 while prescribing opioids at 5.1 times the county rate |
| Historical Exclusion | Cross-reference against federal exclusion lists | Eight excluded providers still appeared in active 2023 claims data |
No single signal catches everything. A provider may have a moderate opioid rate but still stand out because of unusually high volume, rapid growth, or a suspicious payment relationship.
Systems that only screen for obvious thresholds — such as raw opioid percentage — miss providers who structure their behavior around fixed rules.
Gap 1 — No Run-to-Run Comparison
A single-period report tells investigators who looks risky today. It does not show who became risky since the last review, who improved, or who moved from HIGH to CRITICAL risk.
Without period-over-period comparison, every report becomes a fresh triage exercise. Investigators repeatedly review the same providers without a clear view of trajectory.
In our pilot, run-to-run comparison surfaced providers whose risk level escalated across periods. A static report would have shown them as merely “still flagged.” The delta showed something more important: acceleration.
For Medicaid program integrity teams, that difference matters. A provider who is steadily risky may require monitoring. A provider whose risk is worsening quickly may require immediate referral.
Gap 2 — No Dollar Exposure Quantification
A risk score is useful to an analyst. A dollar figure is useful to leadership.
A composite score of 65 out of 100 may suggest elevated risk, but it does not answer the budget question: how much money is potentially at stake? A projected exposure of $498,000 does.
Many fraud detection systems stop at risk tiers such as CRITICAL, HIGH, or MEDIUM. That leaves investigators to manually translate statistical concern into financial impact.
A modern Medicaid fraud detection system should estimate exposure at the provider level so program leaders can prioritize cases by both likelihood of fraud and potential financial impact.
Gap 3 — No Referral Routing Logic
Flagging a provider is not the same as knowing where the case should go.
Different fraud signals imply different next steps: a federal exclusion violation may belong with OIG, a suspicious billing pattern may belong with a Medicaid Fraud Control Unit, and specialty-inappropriate prescribing may require licensing-board review.
When systems produce only a flat list of high-risk providers, they push referral decisions back onto already stretched program integrity teams.
Detection tools should classify not only risk level, but also likely referral path. That turns analytics into an operational workflow.
Gap 4 — No Investigation Status Workflow
A provider flag should have a lifecycle: newly flagged, referred, under review, cleared, resolved, or still active.
Without a persistent status field, agencies cannot easily answer what happened after the system generated the alert.
That is a major oversight problem. Six months later, a state may know that a provider was flagged, but not whether anyone acted on it.
A detection system should preserve institutional memory. The goal is not just to identify risk, but to prove that risk was reviewed and handled appropriately.
Gap 5 — No Pre-Payment Interception
The largest gap is also the most structural: most fraud detection happens after payment.
Historical claims analysis is valuable, but it is always one billing cycle behind. By the time a post-payment system identifies a pattern, the claims have already been paid and the state is trying to recover funds.
The longer-term opportunity is to integrate detection scoring earlier in the claims adjudication process. Not every suspicious claim should be denied automatically, but high-risk claims should be routed for review before the loss compounds.
Post-payment analytics can help recover funds. Pre-payment analytics can help prevent the loss in the first place. The CMS Medicaid Integrity Program has long emphasized the importance of shifting from reactive to proactive program integrity approaches.
How Jarvis AI Approaches the Problem
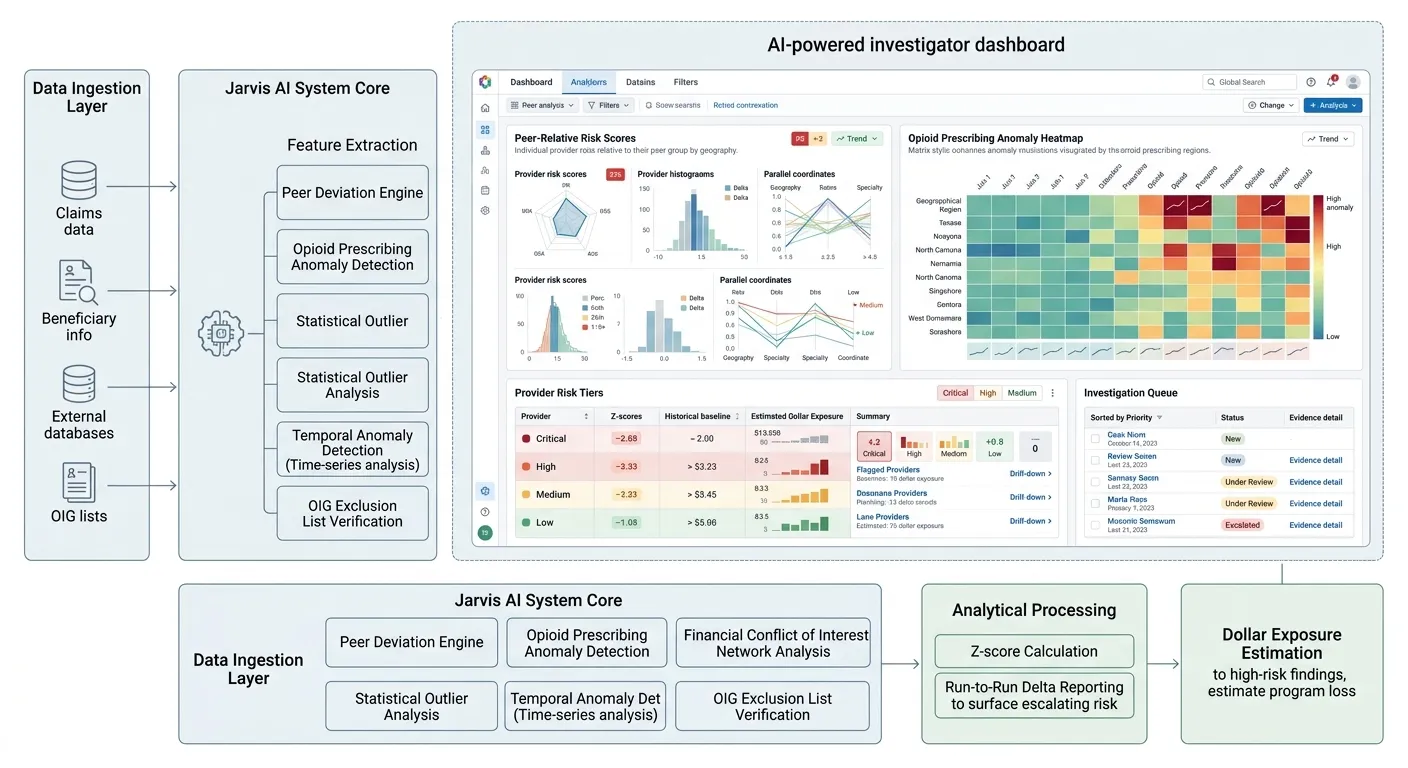
The Jarvis AI pilot was designed to add comparative and operational layers that traditional systems often lack.
| Capability | Legacy Rules-Based SIU Engine | Jarvis AI Pilot |
|---|---|---|
| Peer-relative scoring | Static thresholds | Z-scores recalculated by period and specialty |
| Multi-year provider baseline | Often absent | Six-year historical average per provider |
| Federal exclusion cross-reference | Periodic or stale | Automated every run |
| Run-to-run delta reporting | No | New flags, escalations, and resolutions surfaced automatically |
| Dollar exposure estimate | Usually manual | Automated per provider |
| Natural language query interface | No | Yes |
Key advantages of the Jarvis AI approach include:
- Comparing providers against peers, geography, specialty, and their own historical baseline.
- Recalculating statistical risk rather than relying only on static thresholds.
- Automatically surfacing new flags, escalations, and resolved cases.
- Connecting statistical risk to financial exposure and investigator workflow.
Legacy rules engines are not useless. They catch real problems. But static thresholds become weaker as fraud patterns evolve. Providers who learn to stay just below a fixed rule can evade detection for long periods. The CMS Open Payments Database adds another data dimension — tracking financial relationships between pharmaceutical manufacturers and healthcare providers — that Jarvis AI incorporates alongside claims data.
Watch the Demo
The accompanying demo shows how the pilot turns claims and public integrity data into an investigator-ready workflow.
Watch the Jarvis AI fraud detection demo on YouTube
In the demo, investigators can:
- Identify providers with fraud-consistent pharmacy prescribing patterns.
- Compare opioid prescribing against county, specialty, and historical baselines.
- Review statistical outliers, peer-deviation signals, temporal anomalies, payment relationships, and exclusion-list matches.
- Separate new flags from continuing risks through run-to-run delta reporting.
- Use the evidence trail to support triage, referral, and follow-up.
The goal is not simply to generate a suspicious-provider list. The goal is to convert statistical anomalies into defensible, prioritized cases.
Five Questions Every State Should Ask
When evaluating a pharmacy fraud detection engagement, Medicaid leaders should ask five practical questions:
-
Does the system compare providers to their own history, or only to peers?
Peer comparison catches providers who are unusual relative to others. Historical comparison catches providers whose behavior changed dramatically over time. -
Can it estimate dollar exposure, or only produce a risk score?
Risk scores help analysts. Dollar estimates help agencies prioritize action. -
Does detection happen before or after payment?
Post-payment tools support recovery. Pre-payment workflows support prevention. -
Does the system track what happened after a flag was generated?
A flag without lifecycle tracking can be generated, forgotten, and regenerated next quarter. -
Can investigators ask direct questions, or only read static reports?
Static reports answer expected questions. A queryable system helps investigators explore the specific case in front of them.
The ASCENDING Approach
ASCENDING built this pilot because state Medicaid fraud detection needs more than another dashboard. It needs systems that connect detection, prioritization, referral, and follow-up.
ASCENDING brings:
- Minority-owned small business status and headquarters in Fairfax, Virginia.
- Public-sector delivery experience across Virginia, Maryland, Texas, Florida, Louisiana, Arizona, and other states.
- Production system experience for the City of Phoenix Water Services Division.
- Multiple State of Texas master contract vehicles.
- Federal subcontract support for the U.S. Navy.
Our approach is additive. We do not believe states should replace existing program integrity processes with an unproven black box. Instead, we help agencies strengthen what they already do: compare providers more intelligently, quantify exposure, identify emerging risk, and route cases to the right team faster.
Learn more at ascendingdc.com.
Closing
Medicaid fraud detection does not fail because states lack data. It fails when data cannot be converted into timely action.
The Tennessee pilot showed that the next step in program integrity is not just better scoring. It is:
- Better comparison.
- Better financial prioritization.
- Better referral logic.
- Better case tracking.
- Earlier intervention.
The state that closes these five gaps first will not only detect more fraud. It will detect it faster, prove it acted, and prevent losses before they become audit findings.
Investigations in other public-safety settings face a related problem: AI findings need proof that holds up in discovery. See what investigative AI is missing for the courtroom.
References
| Source | Link |
|---|---|
| Jarvis AI Fraud Detection Demo | https://www.youtube.com/watch?v=2iwpWCYEy9k |
| CMS Medicare Part D Public Use Files | https://www.cms.gov/medicare/prescription-drug-coverage/prescriptiondrugcovgenin |
| OIG List of Excluded Individuals/Entities | https://oig.hhs.gov/exclusions |
| HHS OIG Medicaid Fraud Control Units | https://oig.hhs.gov/reports-and-publications/featured-topics/mfcu/ |
| CMS Open Payments Database | https://openpaymentsdata.cms.gov |
| CMS Medicaid Integrity Program | https://www.cms.gov/medicare/provider-enrollment-and-certification/medicaidintegritypgm |
| ASCENDING Inc. | https://ascendingdc.com |