

When your design engineer asks whether the utility lines on a highway base map are “accurate,” the honest answer is almost always: it depends on which line. Some were located by a test hole last spring. Some were traced from a 1970s plat that nobody has checked since. On most base maps they look exactly the same, and that is the problem AI utility mapping has to solve.
I want to be very clear: utility owner records, design CAD files, enterprise GIS and the subsurface utility engineering — SUE — discipline are not the weak link. SUE in particular has given transportation agencies a rigorous vocabulary for how much a utility depiction can be trusted, and the FHWA has encouraged its use on Federal-aid highway projects since 1991. Those tools were built to record utilities and to survey them. They were not built to keep thousands of records and field observations reconciled across hundreds of projects a year.
This post maps the flows that utility information takes through highway design, the capability gaps that matter, and a concept we call the utility reconciliation layer: an AI layer that sits between existing records and the design team, keeps every line honest about where it came from, and tells engineers where to dig.
The Four Flows That Define Utility Mapping for Highway Design
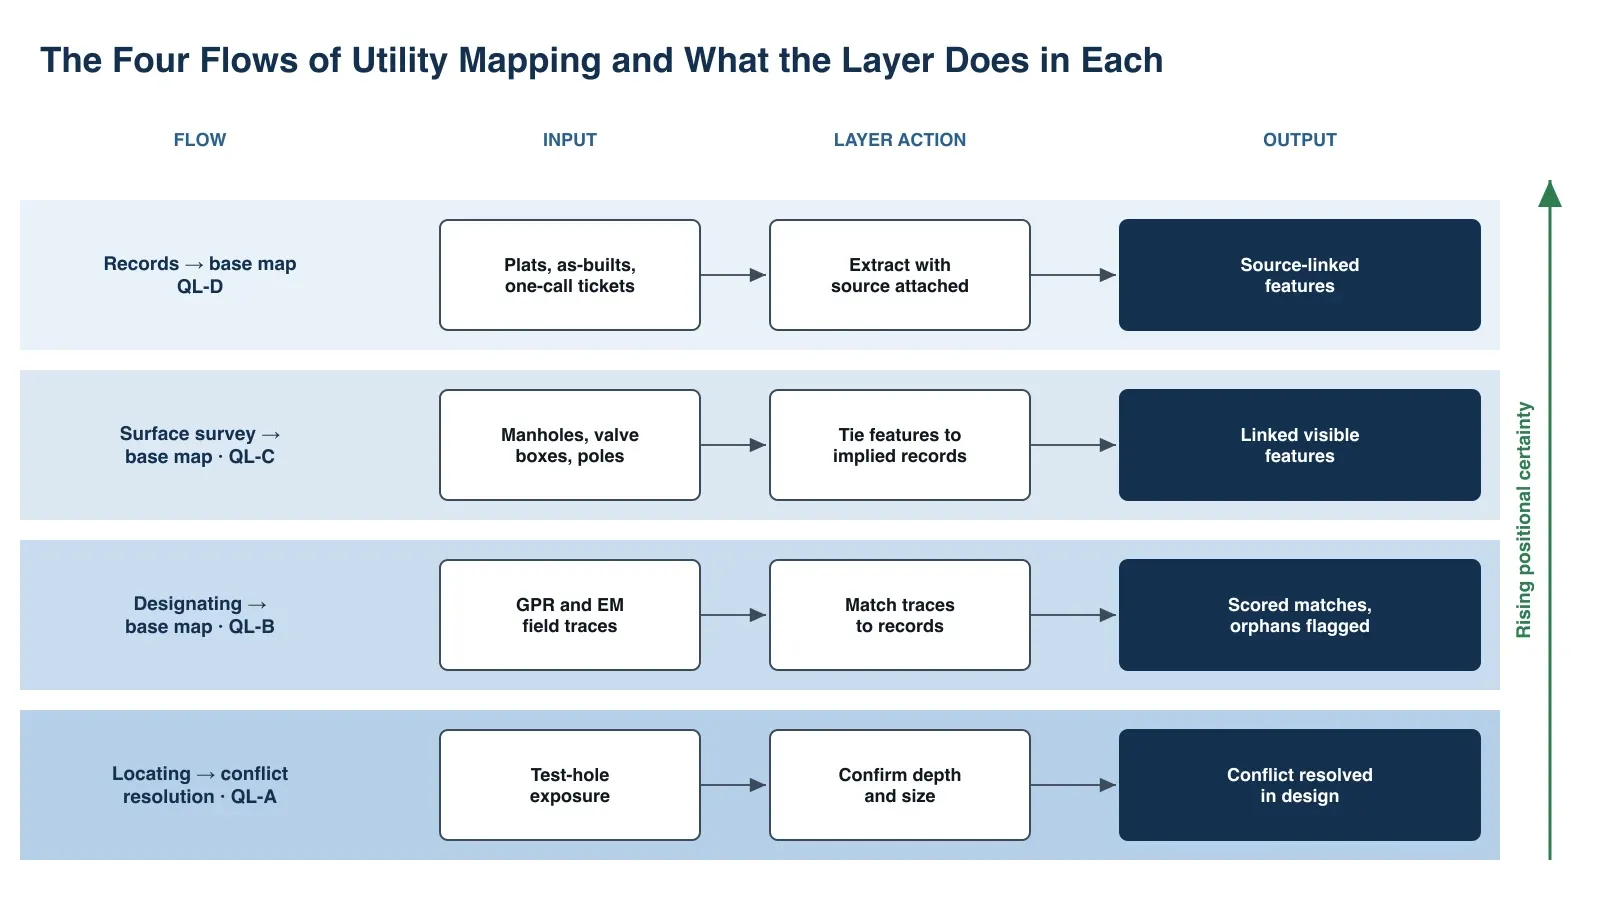
Utility information reaches a design in four distinct flows, each tied to a SUE quality level. Quality levels run from QL-D (records only) to QL-A (exposed and measured), so positional certainty rises as the level moves from QL-D to QL-A:
| Quality level | How the line is established | Flow below |
|---|---|---|
| QL-D | Owner plats, as-builts and one-call tickets | Records → base map |
| QL-C | Surveyed surface features such as manholes, valve boxes and poles | Surface survey → base map |
| QL-B | Ground-penetrating radar and electromagnetic sweeps | Designating → base map |
| QL-A | Vacuum excavation exposing the utility | Locating → conflict resolution |
Each flow below produces lines at one of those levels, and each asks something different of the mapping:
| Flow | Concrete Example | What Mapping Must Do |
|---|---|---|
| Records → base map · QL-D | Owner plats, as-builts and one-call tickets compiled for a corridor | Extract lines from scans, CAD and GIS with the source attached |
| Surface survey → base map · QL-C | Crew surveys manholes, valve boxes and poles | Tie visible features to the records they imply |
| Designating → base map · QL-B | Ground-penetrating radar and electromagnetic sweeps trace horizontal position | Match field traces to records; flag the unrecorded |
| Locating → conflict resolution · QL-A | Vacuum excavation exposes a duct bank at a planned drainage crossing | Confirm depth and size where it changes the design |
The first and third flows cause most of the friction. Records are plentiful, inconsistent and often wrong; designating reveals the gap but produces a second, disagreeing dataset that someone must reconcile by hand.
The Four Capability Gaps That Actually Matter
Gap 1: Multi-format record ingestion with provenance
A single corridor can draw on scanned paper plats, owner CAD files, GIS exports and marked-up PDFs. Today a technician redraws them into the design file, and the link to the source disappears in the process. An AI layer can extract line geometry, owner, material and size from each format, but its real value is that every extracted feature keeps a pointer to the exact document and page it came from.
Gap 2: Quality-level attribution per segment
ASCE 38-22 gives each depiction a quality level, from QL-D records to QL-A exposure. That level often lives in a title-block note rather than on the line itself. A segment that is QL-B for 200 feet and QL-D for the next 300 should say so. The rule for the AI is simple: it may propose a quality level, but it can never upgrade one without field evidence.
Gap 3: Record-to-field reconciliation
Designating produces traces that should match records — and frequently don’t. Lines are offset, abandoned facilities still appear in records, and live conductors appear in no record at all. Matching thousands of traces to thousands of record features is exactly the kind of pattern work machine learning does well, provided every proposed match carries a confidence score and a reviewer can reject it.
Gap 4: Conflict prediction and test-hole prioritization
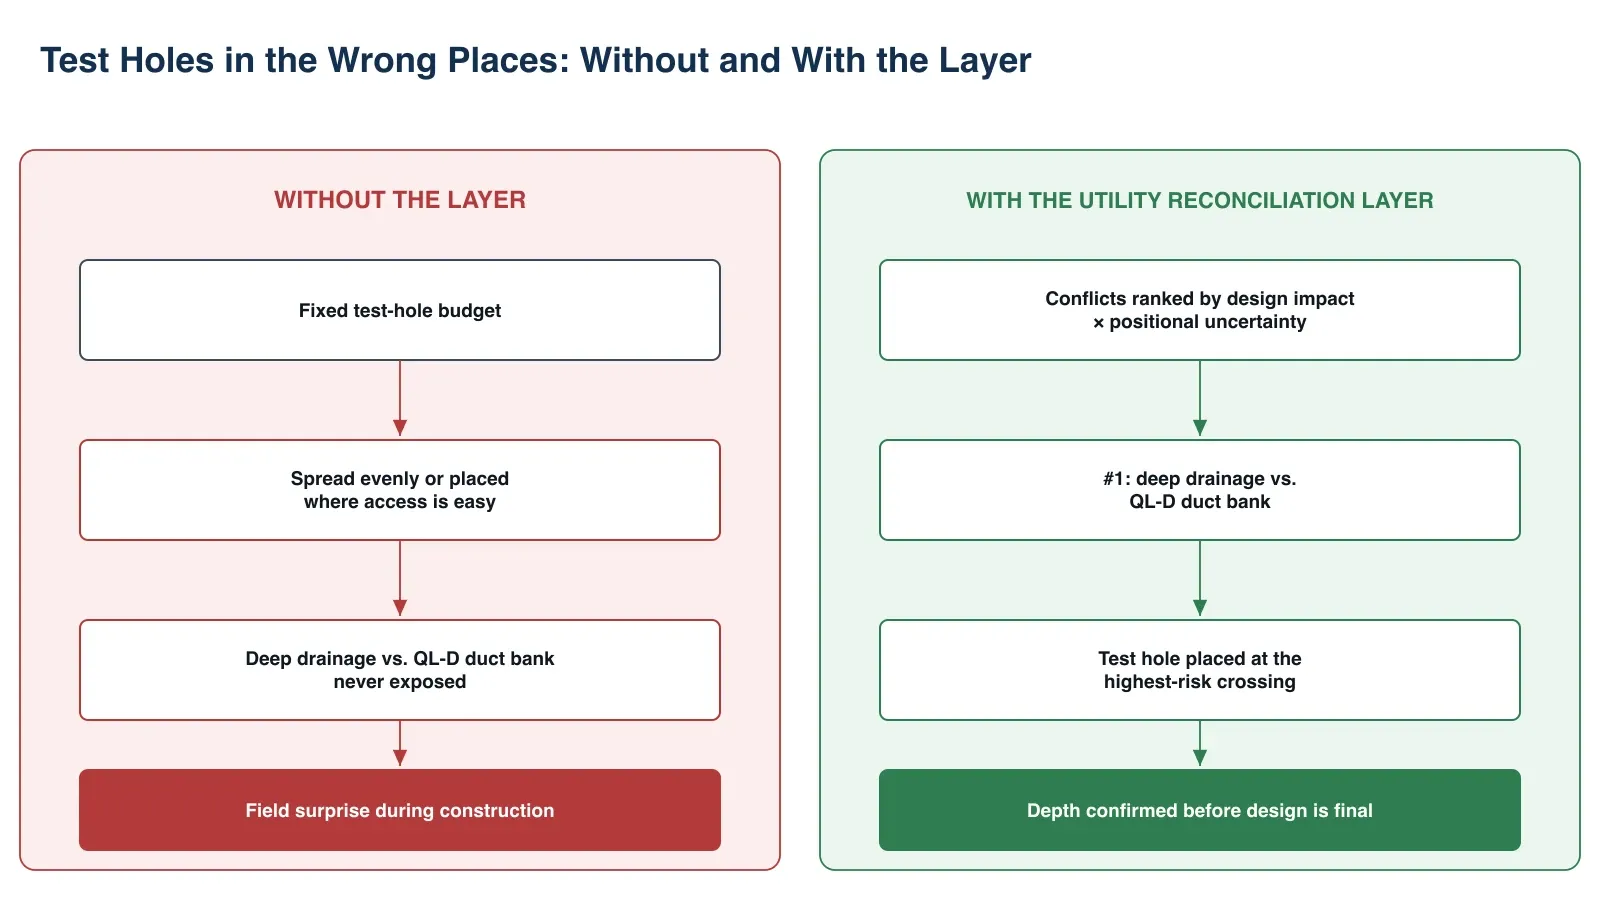
Once utilities and the proposed design share one model, the question becomes where a conflict is likely and how much the uncertainty matters. A storm drain crossing a QL-D gas main is a very different risk from one crossing a QL-A fiber line. Ranking conflicts by design impact multiplied by positional uncertainty tells the team where a limited test-hole budget buys the most certainty.
How Traditional Utility Mapping Tools Compare
| Capability | Design CAD Files | Enterprise GIS Utility Records | SUE Field Deliverable | Utility Reconciliation Layer |
|---|---|---|---|---|
| Multi-format ingestion with source links | ⚠️ Manual redraw | ⚠️ Owner’s own data only | ❌ Not in scope | ✅ Every feature cites its source |
| Quality level on each segment | ⚠️ Layer or note convention | ❌ Rarely carried | ✅ For surveyed segments | ✅ Carried and never auto-upgraded |
| Record-vs-field discrepancy detection | ❌ | ❌ | ⚠️ Engineer judgment, by hand | ✅ Scored matches, human review |
| Conflict ranking by uncertainty | ⚠️ Clash detection, no uncertainty | ❌ | ⚠️ Conflict matrix, manual | ✅ Ranked test-hole plan |
| As-built feedback to records | ❌ | ⚠️ Depends on owner process | ❌ | ✅ Field truth flows back |
The ✅, ⚠️ and ❌ ratings above are this post’s own qualitative assessment, not a sourced benchmark.
The discrepancy row is unanimous. No incumbent tool is designed to compare what the records say against what the field crew found, at scale, across every project. That comparison is where the risk actually lives.
Each tool is strong in its own lane. CAD is the design of record, GIS is the owner’s system of record, and the SUE deliverable is the professional judgment of record. The reconciliation layer connects them — it replaces none of them.
Quality levels exist, but they don’t travel. The SUE deliverable knows the quality level; the design file and the owner’s GIS usually forget it.
What the Gaps Mean in Practice
Failure mode 1: The record that looked like a survey. (An illustrative scenario.) A QL-D water line is drafted on the base map in the same line style as surveyed utilities. A designer places a signal pole foundation two feet away. The main is actually eight feet east, under the foundation, and the conflict surfaces during construction as a change order. The root cause is not a bad record; it is a lost quality level.
Failure mode 2: The orphan conductor. Designating finds a live cable that appears in no owner record. It goes on the base map as “unknown,” nobody is assigned to identify the owner, and the relocation agreement that should have started in design starts during construction instead.
Failure mode 3: Test holes in the wrong places. A project has budget for a fixed number of test holes. They are spread evenly along the corridor or placed where access is easy. The highest-risk crossing — a deep drainage structure against a QL-D duct bank — never gets exposed, and that is where the field surprise happens.
The Utility Reconciliation Layer Concept
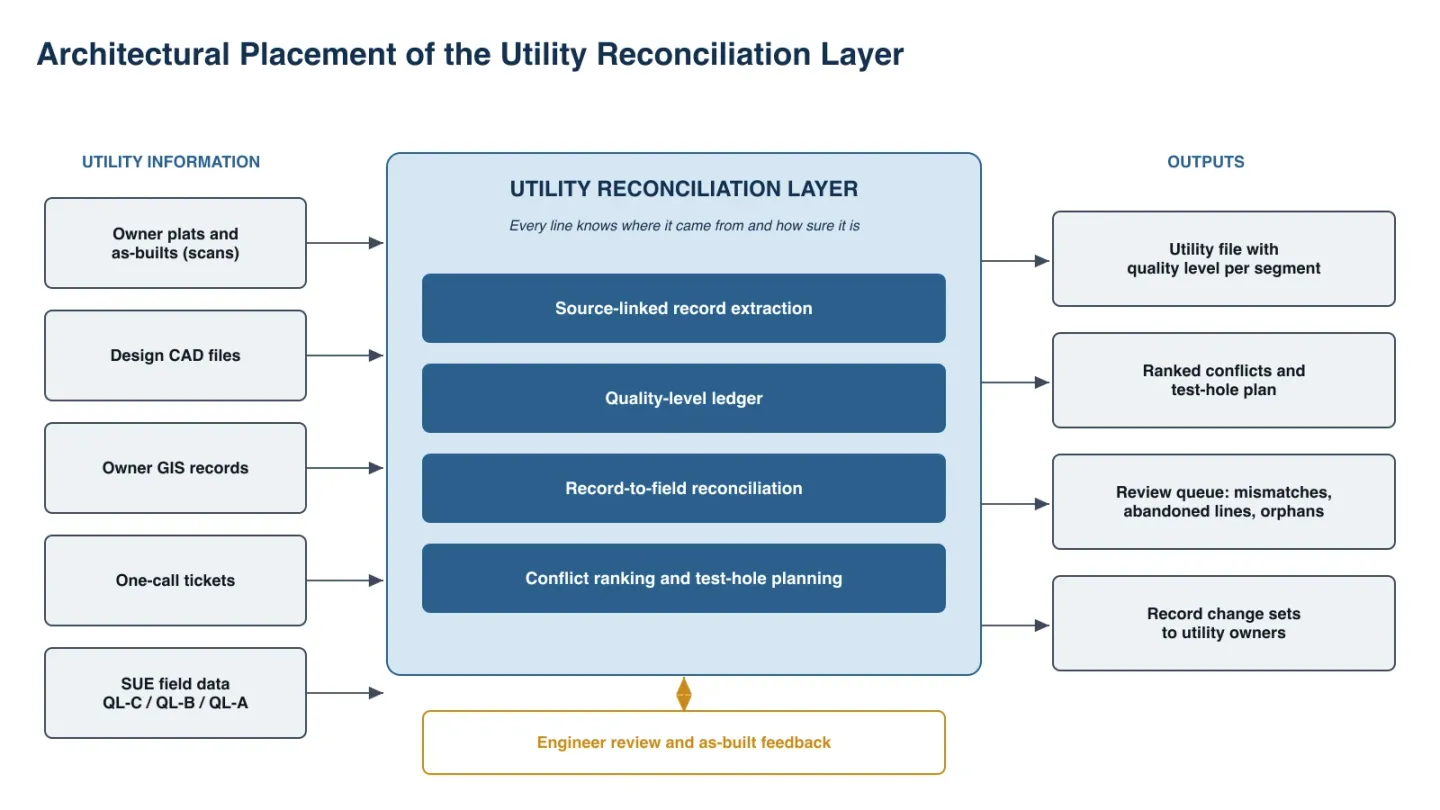
The utility reconciliation layer is an AI layer between an agency’s utility information and its design team. It does not replace the SUE consultant, the licensed engineer who seals the utility plan, the owner’s GIS or the design CAD platform. It keeps them consistent with each other.
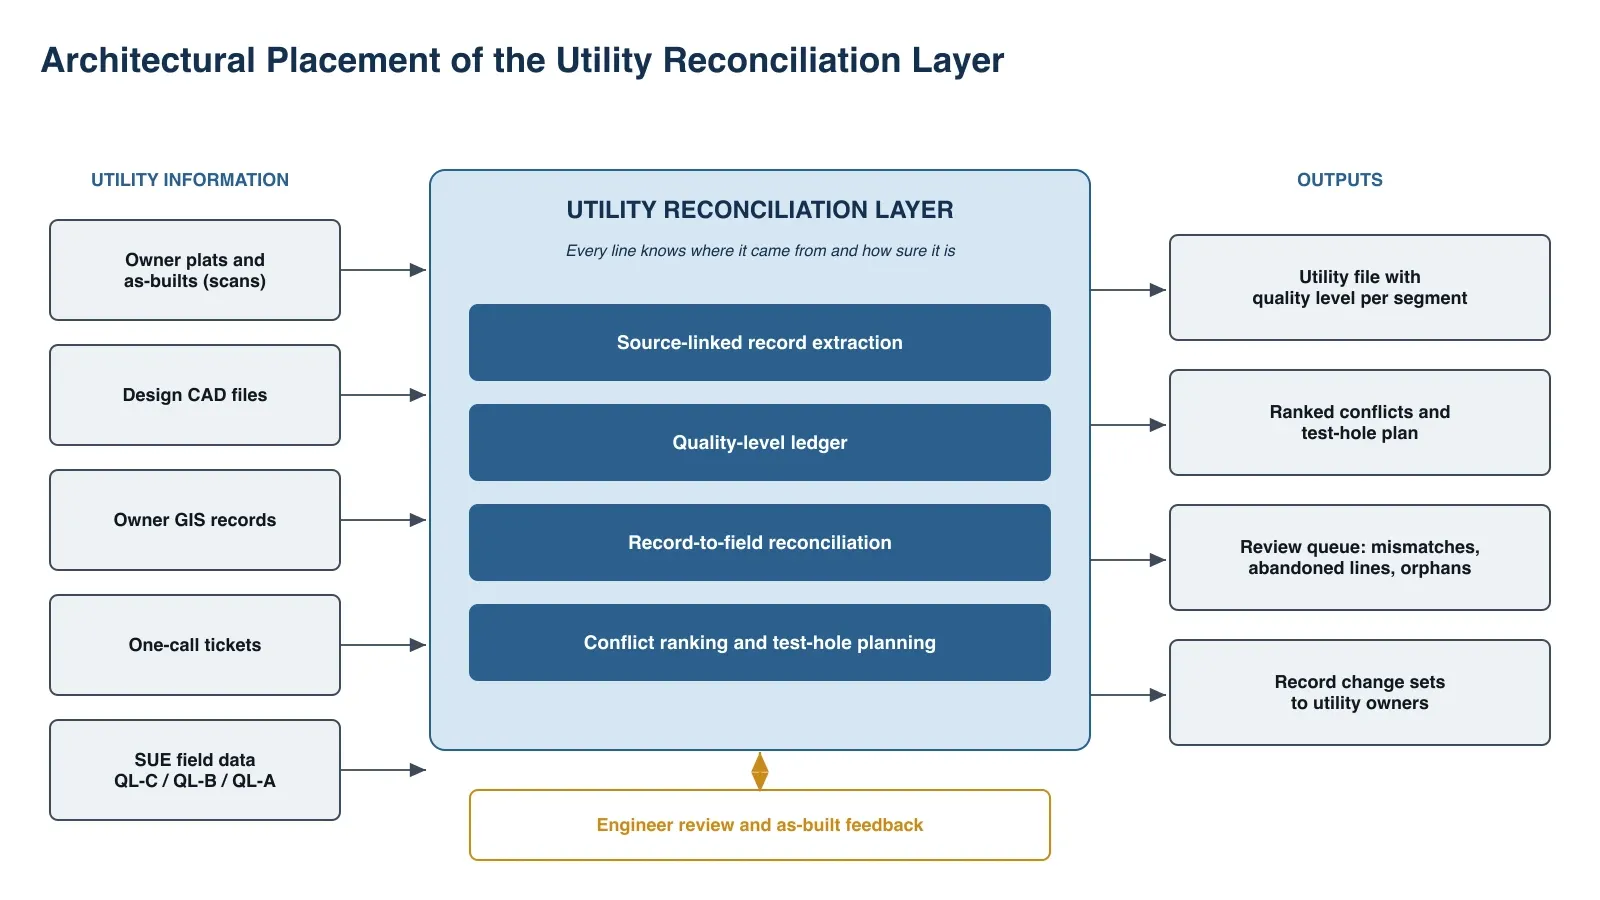
Source-linked record extraction. Scans, CAD, GIS and PDFs become features that each cite the document and page they came from.
Quality-level ledger. Every segment carries its quality level and the evidence behind it; only field evidence can raise it.
Record-to-field reconciliation. Designated traces are matched to records with confidence scores; mismatches, abandoned lines and orphans go to a review queue.
Conflict ranking and test-hole planning. Conflicts are ranked by design impact and positional uncertainty, producing a prioritized, risk-based test-hole plan.
Engineer review and as-built feedback. A licensed engineer accepts or rejects every proposed change, and confirmed field truth flows back toward the records — the intent behind ASCE 75-22’s as-built data standard.
Integration with Design and GIS Platforms
CAD design environments
Most highway design runs in Bentley OpenRoads or Autodesk Civil 3D. The layer should deliver its output as an ordinary utility file, with quality level as an attribute and a symbology convention, so designers keep working in the tool they know. No new viewer, no second base map.
Enterprise GIS and owner records
Owner and agency utility data often lives in Esri ArcGIS, including the ArcGIS Utility Network model. The layer reads from it rather than replacing it, and proposes record corrections back to the owner as reviewable change sets. The owner decides what becomes the record.
Five Questions for Evaluating an AI Utility Mapping Pilot
-
Can every line on the output trace back to a source document or field observation? If a vendor can’t show provenance per feature, the map is a drawing, not evidence.
-
Does the AI ever raise a quality level on its own? The right answer is no. Only field evidence moves a line from QL-D to QL-B or QL-A.
-
How are record-to-field mismatches surfaced and resolved? Look for confidence scores, a review queue and a log of who decided what.
-
Does the conflict analysis tell you where to dig? A clash list is not a test-hole plan. Ranking by uncertainty is the test.
-
Does confirmed field truth flow back to the records? Otherwise the next project starts from the same wrong plat.
The Jarvis Utility Reconciliation Layer
At ASCENDING, these questions shaped how we would apply Jarvis AI to utility mapping. Jarvis ingests PDFs, Word and Excel files and SQL data sources, and enforces mandatory source attribution: an output that can’t be traced to a source is flagged, not invented. Its human-in-the-loop checkpoints put an engineer’s decision in front of every proposed change, every action is logged for audit, and its governance workflows follow the NIST AI Risk Management Framework. Jarvis deploys inside the agency’s own cloud, so utility records — often security-sensitive — never leave its boundary.
For related public-sector work, see how the same discipline applies to water utility analytics readiness and municipal permit completeness checks.
Learn more about Jarvis source-attributed document intelligence.
Closing
Utility owner records, CAD, GIS and SUE are not obsolete. They are the reason agencies know as much as they do about what lies under their roads, and SUE’s quality levels remain the right way to describe how much to trust a line.
What they lack is a layer that keeps records and field reality reconciled across every project, carries the quality level with every segment and points the next test hole at the highest risk. That is the utility reconciliation layer.
The utilities are already in the ground. The question is whether the map tells you how sure it is.
References
| Source | Link |
|---|---|
| FHWA — Subsurface Utility Engineering | https://www.fhwa.dot.gov/programadmin/sueindex.cfm |
| ASCE — ASCE 38-22 and companion standard ASCE 75-22 now available | https://www.asce.org/publications-and-news/civil-engineering-source/society-news/article/2022/07/newly-updated-asce-38-22-utility-engineering-standard-and-new-companion-standard-asce-75-22-now-available |
| NIST — AI Risk Management Framework | https://www.nist.gov/itl/ai-risk-management-framework |
| ASCENDING Inc. — Smart Data and Machine Learning | https://ascendingdc.com/cloud-services/smart-data/ |
| ASCENDING Inc. — Jarvis AI Knowledge Base | https://ascendingdc.com/jarvis-ai/knowledge-base/ |